Anti-Debugging - Multiple Techniques
Detecting debuggers using various techniques.
Jump to Section (17)
- Learning Objectives
- Introduction
- Detecting Debuggers Via IsDebuggerPresent
- IsDebuggerPresent Replacement (1)
- IsDebuggerPresent Replacement (2)
- Detecting Debugger Via NtQueryInformationProcess
- ProcessDebugPort Flag
- ProcessDebugObjectHandle Flag
- NtQueryInformationProcess Anti-Debugging Code
- Detecting Debugger Via Hardware Breakpoints
- Retrieving The Value Of The Registers
- Detecting Debuggers Via BlackListed Arrays
- Breakpoint Detection Via GetTickCount64
- Detecting Delays
- GetTickCount64 Anti-Debugging Code
- Breakpoint Detection Via QueryPerformanceCounter
- Detecting Debugger Via DebugBreak
- Detecting Debugger Via OutputDebugString
- Companion Source Code
Learning Objectives
0/3 doneIntroduction
Security researchers and malware analysts will use debugging to enhance their understanding of malware samples. This enables them to write better detection rules against these samples. As a malware developer, one should always arm themselves with anti-debugging techniques to make the process more time-consuming for analysts.
This module discusses several anti-debugging techniques.
Detecting Debuggers Via IsDebuggerPresent
One of the easiest anti-debugging techniques is to use the IsDebuggerPresent WinAPI. This function returns TRUE if a debugger is attached to the calling process or FALSE if there isn't. The following code snippet shows the function to detect a debugger.
if (IsDebuggerPresent()) {
  printf("[i] IsDebuggerPresent detected a debugger \n");
  // Run harmless code..
}
IsDebuggerPresent Replacement (1)
Calling the IsDebuggerPresent WinAPI is suspicious even
if it is well hidden through API hashing. The WinAPI is considered a
very basic approach to detect debuggers and can be bypassed with tools
like ScyllaHide which is an anti anti-debugger plugin for xdbg.
A better approach is to create a custom version of the IsDebuggerPresent WinAPI. Recall the Windows Processes - beginner module which showed the PEB structure having a BeingDebugged member that is set to 1 when the process is being debugged. A simple IsDebuggerPresent WinAPI replacement involves checking the BeingDebugged value as shown in the custom function below.
The IsDebuggerPresent2 function returns TRUE if the BeingDebugged element is set to 1.
BOOL IsDebuggerPresent2() {

  // getting the PEB structure
#ifdef _WIN64
	PPEB					pPeb = (PEB*)(__readgsqword(0x60));
#elif _WIN32
	PPEB					pPeb = (PEB*)(__readfsdword(0x30));
#endif

  // checking the 'BeingDebugged' element
  if (pPeb->BeingDebugged == 1)
    return TRUE;

   return FALSE;
}
IsDebuggerPresent Replacement (2)
Another way to make a custom-made version of the IsDebuggerPresent WinAPI is by utilizing the undocumented NtGlobalFlag flag which is also found within the PEB structure. The NtGlobalFlag member is set to 0x70 (hex) if the process is being debugged otherwise it's 0. It's important to note that the NtGlobalFlag element is set to 0x70
only when the process is created by the debugger. Therefore, this
method will fail in detecting a debugger if it was attacher after
execution.
The value 0x70 is derived from the combination of the following flags:
-
FLG_HEAP_ENABLE_TAIL_CHECK-0x10 -
FLG_HEAP_ENABLE_FREE_CHECK-0x20 -
FLG_HEAP_VALIDATE_PARAMETERS-0x40
The IsDebuggerPresent3 function returns TRUE if the NtGlobalFlag element is set to 0x70.
#define FLG_HEAP_ENABLE_TAIL_CHECK   0x10
#define FLG_HEAP_ENABLE_FREE_CHECK   0x20
#define FLG_HEAP_VALIDATE_PARAMETERS 0x40

BOOL IsDebuggerPresent3() {

  // getting the PEB structure
#ifdef _WIN64
	PPEB					pPeb = (PEB*)(__readgsqword(0x60));
#elif _WIN32
	PPEB					pPeb = (PEB*)(__readfsdword(0x30));
#endif

  // checking the 'NtGlobalFlag' element
  if (pPeb->NtGlobalFlag == (FLG_HEAP_ENABLE_TAIL_CHECK | FLG_HEAP_ENABLE_FREE_CHECK | FLG_HEAP_VALIDATE_PARAMETERS))
    return TRUE;

  return FALSE;
}
Detecting Debugger Via NtQueryInformationProcess
The NtQueryInformationProcess syscall will be utilized to detect debuggers via two flags, ProcessDebugPort and ProcessDebugObjectHandle.
Recall that NtQueryInformationProcess looks like the following
NTSTATUS NtQueryInformationProcess(
  IN    HANDLE           ProcessHandle,               // Process handle for which information is to be retrieved.
  IN    PROCESSINFOCLASS ProcessInformationClass,     // Type of process information to be retrieved
  OUT   PVOID            ProcessInformation,          // Pointer to the buffer into which the function writes the requested information
  IN    ULONG            ProcessInformationLength,    // The size of the buffer pointed to by the 'ProcessInformation' parameter
  OUT   PULONG           ReturnLength                 // Pointer to a variable in which the function returns the size of the requested information
);
ProcessDebugPort Flag
Microsoft's documentation on the ProcessDebugPort flag states the following:
Retrieves a DWORD_PTR value that is the port number of the debugger for the process. A nonzero value indicates that the process is being run under the control of a ring 3 debugger
In other words, if NtQueryInformationProcess returns a non-zero value received by the ProcessInformation parameter, the process is being actively debugged.
ProcessDebugObjectHandle Flag
The undocumented flag, ProcessDebugObjectHandle, works like the former ProcessDebugPort
flag and is used to get a handle to the debug object handle of the
current process which is created if the process is being debugged. A
non-zero value obtained by the ProcessInformation parameter through NtQueryInformationProcess implies active debugging of the process.
In the case where NtQueryInformationProcess fails to retrieve the debug object handle, it means it did not detect a debugger and will return the error code 0xC0000353. Based on Microsoft's documentation on NTSTATUS Values, the error code is equivalent to STATUS_PORT_NOT_SET.
NtQueryInformationProcess Anti-Debugging Code
The NtQIPDebuggerCheck function uses both ProcessInformation & ProcessDebugObjectHandle to detect debuggers. The function returns TRUE if NtQueryInformationProcess returns a valid handle using both ProcessDebugPort and ProcessDebugObjectHandle flags.
BOOL NtQIPDebuggerCheck() {

	NTSTATUS                      STATUS                        = NULL;
	fnNtQueryInformationProcess   pNtQueryInformationProcess    = NULL;
	DWORD64                       dwIsDebuggerPresent           = NULL;
	DWORD64                       hProcessDebugObject           = NULL;

	// Getting NtQueryInformationProcess address
	pNtQueryInformationProcess = (fnNtQueryInformationProcess)GetProcAddress(GetModuleHandle(TEXT("NTDLL.DLL")), "NtQueryInformationProcess");
	if (pNtQueryInformationProcess == NULL) {
		printf("\t[!] GetProcAddress Failed With Error : %d \n", GetLastError());
		return FALSE;
	}

	// Calling NtQueryInformationProcess with the 'ProcessDebugPort' flag
	STATUS = pNtQueryInformationProcess(
		GetCurrentProcess(),
		ProcessDebugPort,
		&dwIsDebuggerPresent,
		sizeof(DWORD64),
		NULL
	);

	if (STATUS != 0x0) {
		printf("\t[!] NtQueryInformationProcess [1] Failed With Status : 0x%0.8X \n", STATUS);
		return FALSE;
	}

	// If NtQueryInformationProcess returned a non-zero value, the handle is valid, which means we are being debugged
	if (dwIsDebuggerPresent != NULL) {
        // detected a debugger
		return TRUE;
	}

	// Calling NtQueryInformationProcess with the 'ProcessDebugObjectHandle' flag
	STATUS = pNtQueryInformationProcess(
		GetCurrentProcess(),
		ProcessDebugObjectHandle,
		&hProcessDebugObject,
		sizeof(DWORD64),
		NULL
	);

	// If STATUS is not 0 and not 0xC0000353 (that is 'STATUS_PORT_NOT_SET')
	if (STATUS != 0x0 && STATUS != 0xC0000353) {
		printf("\t[!] NtQueryInformationProcess [2] Failed With Status : 0x%0.8X \n", STATUS);
		return FALSE;
	}

	// If NtQueryInformationProcess returned a non-zero value, the handle is valid, which means we are being debugged
	if (hProcessDebugObject != NULL) {
        // detected a debugger
		return TRUE;
	}

	return FALSE;
}
Detecting Debugger Via Hardware Breakpoints
This method is only valid if hardware breakpoints are set during debugging. Hardware breakpoints, also known as hardware debug registers, are a feature of modern microprocessors that pauses the process's execution when a specific memory address or event is triggered. Hardware breakpoints are implemented in the processor itself and are therefore faster and more efficient than the normal software breakpoints, which rely on the operating system or debugger to periodically check the program's execution.
When hardware breakpoints are set, specific registers change in
value. The values of these registers can be used to determine if a
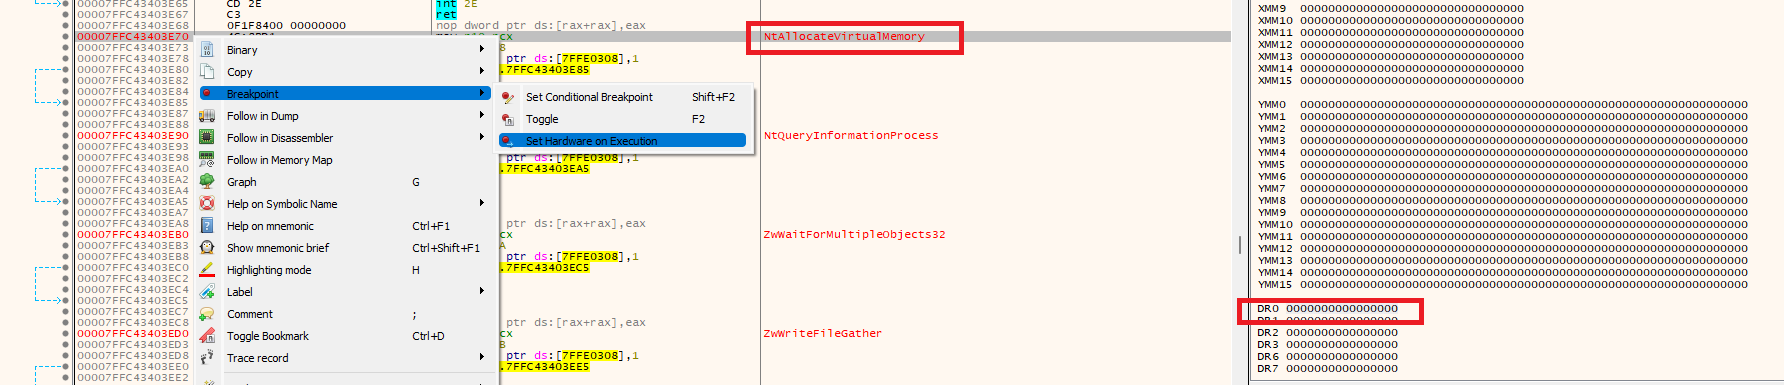
debugger is attached to the process. If the registers Dr0, Dr1, Dr2 and Dr3 contain a non-zero value, then the hardware breakpoint is set. The following example places a hardware breakpoint on the NtAllocateVirtualMemory syscall using the xdbg debugger. Notice how the value of Dr0 is changed from zero to NtAllocateVirtualMemory's address.


Retrieving The Value Of The Registers
To retrieve the value of the Dr registers, the GetThreadContext WinAPI can be used. Recall the usage of GetThreadContext from the Thread Hijacking modules in which it was used to retrieve the context of a specified thread. The context was returned as a CONTEXT structure. This structure also includes the values of the Dr0, Dr1, Dr2 and Dr3 registers.
The HardwareBpCheck function detects the presence of a debugger by checking the values of the aforementioned registers. The function returns TRUEif a debugger is detected.
BOOL HardwareBpCheck() {

	CONTEXT		Ctx		= { .ContextFlags = CONTEXT_DEBUG_REGISTERS };

	if (!GetThreadContext(GetCurrentThread(), &Ctx)) {
		printf("\t[!] GetThreadContext Failed With Error : %d \n", GetLastError());
		return FALSE;
	}

	if (Ctx.Dr0 != NULL || Ctx.Dr1 != NULL || Ctx.Dr2 != NULL || Ctx.Dr3 != NULL)
		return TRUE; // Detected a debugger

	return FALSE;
}
Detecting Debuggers Via BlackListed Arrays
Another way to detect debugging processes can be done by checking the names of currently running processes against a list of known debugger names. This "blacklist" of names is stored in a hardcoded array. If a match is found between the name of a process and the blacklist, then a debugger application is running on the system.
Enumerating the processes running on the machine can be from any of the previously discussed techniques. For this scenario, the CreateToolhelp32Snapshot process enumeration technique will be used.
The blacklist array used is represented as the following
#define BLACKLISTARRAY_SIZE 5 // Number of elements inside the array

WCHAR* g_BlackListedDebuggers[BLACKLISTARRAY_SIZE] = {
		L"x64dbg.exe",                 // xdbg debugger
		L"ida.exe",                    // IDA disassembler
		L"ida64.exe",                  // IDA disassembler
		L"VsDebugConsole.exe",         // Visual Studio debugger
		L"msvsmon.exe"                 // Visual Studio debugger
};
The blacklist array should contain as many debugger names as possible in order to detect a wider range of debuggers. Additionally, the strings should be obfuscated via string hashing as debugger names in the binary could be used as IoCs.
The BlackListedProcessesCheck function uses the g_BlackListedDebuggers array as the blacklist processes array. It will return TRUE in case a process name matches with an element of g_BlackListedDebuggers
BOOL BlackListedProcessesCheck() {

	HANDLE				hSnapShot		= NULL;
	PROCESSENTRY32W		ProcEntry		= { .dwSize = sizeof(PROCESSENTRY32W) };
	BOOL				bSTATE			= FALSE;


	hSnapShot = CreateToolhelp32Snapshot(TH32CS_SNAPPROCESS, NULL);
	if (hSnapShot == INVALID_HANDLE_VALUE) {
		printf("\t[!] CreateToolhelp32Snapshot Failed With Error : %d \n", GetLastError());
		goto _EndOfFunction;
	}

	if (!Process32FirstW(hSnapShot, &ProcEntry)) {
		printf("\t[!] Process32FirstW Failed With Error : %d \n", GetLastError());
		goto _EndOfFunction;
	}

	do {
		// Loops through the 'g_BlackListedDebuggers' array and comparing each element to the
		// Current process name captured from the snapshot
		for (int i = 0; i < BLACKLISTARRAY_SIZE; i++){
			if (wcscmp(ProcEntry.szExeFile, g_BlackListedDebuggers[i]) == 0) {
				// Debugger detected
				wprintf(L"\t[i] Found \"%s\" Of Pid : %d \n", ProcEntry.szExeFile, ProcEntry.th32ProcessID);
				bSTATE = TRUE;
				break;
			}
		}

	} while (Process32Next(hSnapShot, &ProcEntry));


_EndOfFunction:
	if (hSnapShot != NULL)
		CloseHandle(hSnapShot);
	return bSTATE;
}
Breakpoint Detection Via GetTickCount64
Breakpoints are used to pause the execution of a program at a specific point, allowing one to inspect the memory, registers state, variables and more.
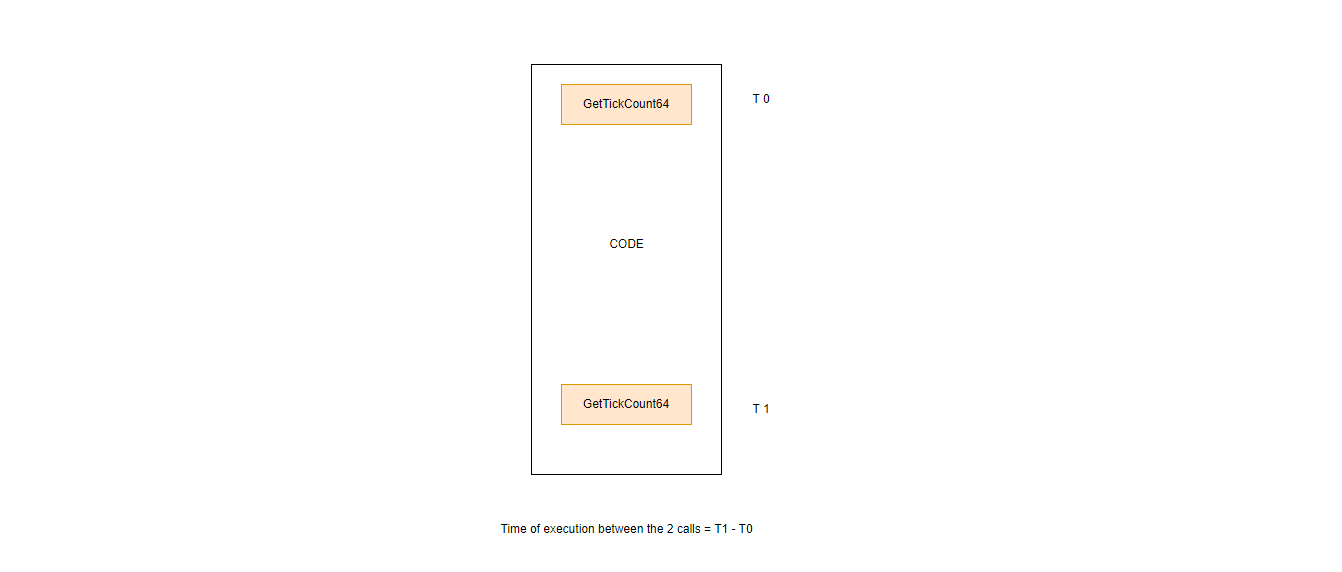
The pause of execution can be detected by using the GetTickCount64
WinAPI. This function retrieves the number of milliseconds that have
elapsed since the system was started. Analyzing the time taken by the
processor between two GetTickCount64 can indicate whether
the malware is being debugged. If the time took longer than expected,
it's safe to assume the malware is being debugged.
Detecting Delays
Breakpoints can be detected by calculating the average of T1 - T0 and storing it as a hardcoded value. When the output of T1 - T0 exceeds this value, the delay is likely caused by breakpoints. For example, if the output of T1 - T0 on the host machine is 20 seconds, but the output is greater than that during runtime, then there is a strong possibility that the delay between these two points is caused by a breakpoint. The original value should be increased slightly to account for processors that may be slower.
GetTickCount64 Anti-Debugging Code
The TimeTickCheck1 function uses the described approach to detect breakpoints. The function returns TRUE if dwTime2 - dwTime1 exceeds the average value of executing code in between, which is 50.
BOOL TimeTickCheck1() {

	DWORD	dwTime1		= NULL,
		    dwTime2		= NULL;

	dwTime1 = GetTickCount64();

/*
		OTHER CODE
*/

	dwTime2 = GetTickCount64();

	printf("\t[i] (dwTime2 - dwTime1) : %d \n", (dwTime2 - dwTime1));

	if ((dwTime2 - dwTime1) > 50) {
		return TRUE;
	}

	return FALSE;
}
Breakpoint Detection Via QueryPerformanceCounter
The QueryPerformanceCounter WinAPI is the same as the previously shown GetTickCount64 WinAPI. The difference is that QueryPerformanceCounter
uses a high-resolution performance counter provided by the hardware
which can measure time in increments of nanoseconds whereas GetTickCount64 uses a time counter that increments every millisecond. Note that QueryPerformanceCounter retrieves the performance-counter value in counts rather than milliseconds.
The TimeTickCheck2 function uses the QueryPerformanceCounter WinAPI to detect breakpoints. It returns TRUE if Time2.QuadPart - Time1.QuadPart exceeds the average value of executing code in between, which is 100000 counts.
BOOL TimeTickCheck2() {

	LARGE_INTEGER	Time1	= { 0 },
			        Time2	= { 0 };

	if (!QueryPerformanceCounter(&Time1)) {
		printf("\t[!] QueryPerformanceCounter [1] Failed With Error : %d \n", GetLastError());
		return FALSE;
	}

/*
		OTHER CODE
*/

	if (!QueryPerformanceCounter(&Time2)) {
		printf("\t[!] QueryPerformanceCounter [2] Failed With Error : %d \n", GetLastError());
		return FALSE;
	}

	printf("\t[i] (Time2.QuadPart - Time1.QuadPart) : %d \n", (Time2.QuadPart - Time1.QuadPart));

	if ((Time2.QuadPart - Time1.QuadPart) > 100000){
		return TRUE;
	}

	return FALSE;
}
Detecting Debugger Via DebugBreak
DebugBreak causes the breakpoint exception, EXCEPTION_BREAKPOINT,
to occur in the current process. This exception is supposed to be
handled by a debugger if it is attached to the current process. The
technique is to trigger the exception and see if a debugger attempts to
handle this exception.
A __try and __except code block will be used to handle the exception from the DebugBreak call, and a GetExceptionCode call will be used to fetch the exception code generated in which case there are two possible scenarios:
-
If the exception fetched is
EXCEPTION_BREAKPOINTthenEXCEPTION_EXECUTE_HANDLERis executed, this means the exception was not handled by a debugger. -
If the exception is not
EXCEPTION_BREAKPOINT, meaning a debugger handled the raised exception (and not our try-except code block), thenEXCEPTION_CONTINUE_SEARCHis executed, this force the debugger to be responsible for handling the raised exception.
The following DebugBreakCheck function returns FALSE if the DebugBreak
WinAPI is successfully executed and the exception is not caught/handled
by a debugger, and instead handled by our try-except code block,
indicating that no debugger is attached to the current process.
BOOL DebugBreakCheck() {

	__try {
		DebugBreak();
	}
	__except (GetExceptionCode() == EXCEPTION_BREAKPOINT ? EXCEPTION_EXECUTE_HANDLER : EXCEPTION_CONTINUE_SEARCH) {
		// if the exception is equal to EXCEPTION_BREAKPOINT, EXCEPTION_EXECUTE_HANDLER is executed and the function return FALSE
		return FALSE;
	}

	// if the exception is not equal to EXCEPTION_BREAKPOINT, EXCEPTION_CONTINUE_SEARCH is executed and the function return TRUE
	return TRUE;
}
Detecting Debugger Via OutputDebugString
Another WinAPI that can be utilized in detecting debuggers is OutputDebugString. This function is used to send a string to the debugger to display. If a debugger exists, then OutputDebugString will succeed in performing its task.
One can run OutputDebugString and check if it failed using GetLastError, if it did, then GetLastError will return a non-zero error code. A non-zero error code in this case is equivalent to no debugger being present. If GetLastError returns zero then OutputDebugString succeeded in sending a string to a debugger.
The OutputDebugStringCheck function uses the above logic and returns TRUE if OutputDebugStringW succeeds. Additionally, it uses SetLastError to set the last error value to 1. This is simply to make sure that it is a non-zero value before the OutputDebugString call in order to reduce false positives.
BOOL OutputDebugStringCheck() {

	SetLastError(1);
	OutputDebugStringW(L"MalDev Academy");

	// if GetLastError is 0, then OutputDebugStringW succeeded
	if (GetLastError() == 0) {
		return TRUE;
	}

	return FALSE;
}
Companion Project & Source Code
5 readable source/config files extracted directly from the archive
// @NUL0x4C | @mrd0x : MalDevAcademy

#include <Windows.h>
#include <stdio.h>
#include <Tlhelp32.h>


#include "Structs.h" //  "PROCESSINFOCLASS" & "PEB"


//------------------------------------------------------------------------------------------------------------------------------------------

BOOL IsDebuggerPresent2() {

#ifdef _WIN64
	PPEB					pPeb = (PEB*)(__readgsqword(0x60));
#elif _WIN32
	PPEB					pPeb = (PEB*)(__readfsdword(0x30));
#endif

	if (pPeb->BeingDebugged == 1)
		return TRUE;

	return FALSE;
}


//------------------------------------------------------------------------------------------------------------------------------------------


/*
	https://www.aldeid.com/wiki/PEB-Process-Environment-Block/NtGlobalFlag
	https://www.geoffchappell.com/studies/windows/win32/ntdll/api/rtl/regutil/getntglobalflags.htm
*/

#define FLG_HEAP_ENABLE_TAIL_CHECK   0x10
#define FLG_HEAP_ENABLE_FREE_CHECK   0x20
#define FLG_HEAP_VALIDATE_PARAMETERS 0x40

BOOL IsDebuggerPresent3() {

#ifdef _WIN64
	PPEB					pPeb = (PEB*)(__readgsqword(0x60));
#elif _WIN32
	PPEB					pPeb = (PEB*)(__readfsdword(0x30));
#endif

	if (pPeb->NtGlobalFlag & (FLG_HEAP_ENABLE_TAIL_CHECK | FLG_HEAP_ENABLE_FREE_CHECK | FLG_HEAP_VALIDATE_PARAMETERS))
		return TRUE;

	return FALSE;
}


//------------------------------------------------------------------------------------------------------------------------------------------

// https://learn.microsoft.com/en-us/windows/win32/api/winternl/nf-winternl-ntqueryinformationprocess

typedef NTSTATUS (WINAPI* fnNtQueryInformationProcess)(
	HANDLE           ProcessHandle,
	PROCESSINFOCLASS ProcessInformationClass,
	PVOID            ProcessInformation,
	ULONG            ProcessInformationLength,
	PULONG           ReturnLength
);


BOOL NtQIPDebuggerCheck() {

	NTSTATUS						STATUS						= NULL;
	fnNtQueryInformationProcess		pNtQueryInformationProcess	= NULL;
	DWORD64							dwIsDebuggerPresent			= NULL;
	DWORD64							hProcessDebugObject			= NULL;

	// getting NtQueryInformationProcess address
	pNtQueryInformationProcess = (fnNtQueryInformationProcess)GetProcAddress(GetModuleHandle(TEXT("NTDLL.DLL")), "NtQueryInformationProcess");
	if (pNtQueryInformationProcess == NULL) {
		printf("\n\t[!] GetProcAddress Failed With Error : %d \n", GetLastError());
		return FALSE;
	}

	// calling NtQueryInformationProcess with the 'ProcessDebugPort' flag
	STATUS = pNtQueryInformationProcess(
		GetCurrentProcess(),
		ProcessDebugPort,
		&dwIsDebuggerPresent,
		sizeof(DWORD64),
		NULL
	);

	// if STATUS is not
	if (STATUS != 0x0) {
		printf("\n\t[!] NtQueryInformationProcess [1] Failed With Status : 0x%0.8X \n", STATUS);
		return FALSE;
	}

	// if NtQueryInformationProcess returned a non-zero value, the handle is valid, which means we are being debugged
	if (dwIsDebuggerPresent != NULL) {
		//printf("\n\t[i] NtQueryInformationProcess [1] - ProcessDebugPort Detected A Debugger \n");
		return TRUE;
	}

	// calling NtQueryInformationProcess with the 'ProcessDebugObjectHandle' flag
	STATUS = pNtQueryInformationProcess(
		GetCurrentProcess(),
		ProcessDebugObjectHandle,
		&hProcessDebugObject,
		sizeof(DWORD64),
		NULL
	);

	// if STATUS is not 0 and not 0xC0000353 (that is 'STATUS_PORT_NOT_SET')
	if (STATUS != 0x0 && STATUS != 0xC0000353) {
		printf("\n\t[!] NtQueryInformationProcess [2] Failed With Status : 0x%0.8X \n", STATUS);
		return FALSE;
	}

	// if NtQueryInformationProcess returned a non-zero value, the handle is valid, which means we are being debugged
	if (hProcessDebugObject != NULL) {
		//printf("\n\t[i] NtQueryInformationProcess [w] - hProcessDebugObject Detected A Debugger \n");
		return TRUE;
	}

	return FALSE;
}


//------------------------------------------------------------------------------------------------------------------------------------------


BOOL HardwareBpCheck() {

	CONTEXT		Ctx		= { .ContextFlags = CONTEXT_DEBUG_REGISTERS };

	if (!GetThreadContext(GetCurrentThread(), &Ctx)) {
		printf("\n\t[!] GetThreadContext Failed With Error : %d \n", GetLastError());
		return FALSE;
	}

	// if one of these registers is not '0', then a hardware bp is installed
	if (Ctx.Dr0 != NULL || Ctx.Dr1 != NULL || Ctx.Dr2 != NULL || Ctx.Dr3 != NULL)
		return TRUE;

	return FALSE;
}


//------------------------------------------------------------------------------------------------------------------------------------------


#define BLACKLISTARRAY_SIZE 5

WCHAR* g_BlackListedDebuggers[BLACKLISTARRAY_SIZE] = {
		L"x64dbg.exe",
		L"ida.exe",
		L"ida64.exe",
		L"VsDebugConsole.exe",
		L"msvsmon.exe"
};


BOOL BlackListedProcessesCheck() {

	HANDLE				hSnapShot					= NULL;
	PROCESSENTRY32W		ProcEntry					= { .dwSize = sizeof(PROCESSENTRY32W) };
	BOOL				bSTATE						= FALSE;


	hSnapShot = CreateToolhelp32Snapshot(TH32CS_SNAPPROCESS, NULL);
	if (hSnapShot == INVALID_HANDLE_VALUE) {
		printf("\n\t[!] CreateToolhelp32Snapshot Failed With Error : %d \n", GetLastError());
		goto _EndOfFunction;
	}

	if (!Process32FirstW(hSnapShot, &ProcEntry)) {
		printf("\n\t[!] Process32FirstW Failed With Error : %d \n", GetLastError());
		goto _EndOfFunction;
	}

	do {

		for (int i = 0; i < BLACKLISTARRAY_SIZE; i++){
			if (wcscmp(ProcEntry.szExeFile, g_BlackListedDebuggers[i]) == 0) {
				wprintf(L"\n\t[i] Found \"%s\" Of Pid : %d\n", ProcEntry.szExeFile, ProcEntry.th32ProcessID);
				bSTATE = TRUE;
				break; // breaking from the for loop
			}
		}

		if (bSTATE)
			break; // breaking from the do-while loop

	} while (Process32Next(hSnapShot, &ProcEntry));


_EndOfFunction:
	if (hSnapShot != NULL)
		CloseHandle(hSnapShot);
	return bSTATE;
}


//------------------------------------------------------------------------------------------------------------------------------------------

// https://learn.microsoft.com/en-us/windows/win32/api/sysinfoapi/nf-sysinfoapi-gettickcount64

BOOL TimeTickCheck1() {

	DWORD	dwTime1		= NULL,
			dwTime2		= NULL;

	dwTime1 = GetTickCount64();

/*

	//	tech 1 :
	if (IsDebuggerPresent()) {
	}
	//	tech 2 :
	if (IsDebuggerPresent2()) {
	}
	//	tech 3 :
	if (NtQIPDebuggerCheck()) {
	}
	//	tech 4 :
	if (HardwareBpCheck()) {
	}
	//	tech 5 :
	if (IsDebuggerPresent3()) {
	}
	//	tech 6 :
	if (BlackListedProcessesCheck()) {
	}


*/

	dwTime2 = GetTickCount64();

	printf("\n\t[i] (dwTime2 - dwTime1) : %d \n", (dwTime2 - dwTime1));

	if ((dwTime2 - dwTime1) > 50) {
		return TRUE;
	}

	return FALSE;
}


//------------------------------------------------------------------------------------------------------------------------------------------

// https://learn.microsoft.com/en-us/windows/win32/api/profileapi/nf-profileapi-queryperformancecounter

BOOL TimeTickCheck2() {

	LARGE_INTEGER	Time1	= { 0 },
					Time2	= { 0 };

	if (!QueryPerformanceCounter(&Time1)) {
		printf("\n\t[!] QueryPerformanceCounter [1] Failed With Error : %d \n", GetLastError());
		return FALSE;
	}

/*

	//	tech 1 :
	if (IsDebuggerPresent()) {
	}
	//	tech 2 :
	if (IsDebuggerPresent2()) {
	}
	//	tech 3 :
	if (NtQIPDebuggerCheck()) {
	}
	//	tech 4 :
	if (HardwareBpCheck()) {
	}
	//	tech 5 :
	if (IsDebuggerPresent3()) {
	}
	//	tech 6 :
	if (BlackListedProcessesCheck()) {
	}
*/


	if (!QueryPerformanceCounter(&Time2)) {
		printf("\n\t[!] QueryPerformanceCounter [2] Failed With Error : %d \n", GetLastError());
		return FALSE;
	}

	printf("\n\t[i] (Time2.QuadPart - Time1.QuadPart) : %d \n", (Time2.QuadPart - Time1.QuadPart));

	if ((Time2.QuadPart - Time1.QuadPart) > 100000){
		return TRUE;
	}

	return FALSE;
}


//------------------------------------------------------------------------------------------------------------------------------------------

// https://learn.microsoft.com/en-us/windows/win32/api/debugapi/nf-debugapi-debugbreak

BOOL DebugBreakCheck() {

	__try {
		DebugBreak();
	}
	__except (GetExceptionCode() == EXCEPTION_BREAKPOINT ? EXCEPTION_EXECUTE_HANDLER : EXCEPTION_CONTINUE_SEARCH) {
		return FALSE;
	}

	return TRUE;
}


//------------------------------------------------------------------------------------------------------------------------------------------


BOOL OutputDebugStringCheck() {

	SetLastError(1);
	OutputDebugStringW(L"MalDev Academy");

	if (GetLastError() == 0) {
		return TRUE;
	}

	return FALSE;
}


//------------------------------------------------------------------------------------------------------------------------------------------


int main() {

	printf("[#] Press <Enter> To Start ... ");
	getchar();

//----------------------------------------------
//	tech 1 :

	printf("\n[#] Running IsDebuggerPresent ... ");
	if (IsDebuggerPresent())
		printf("<<!>> IsDebuggerPresent detected a debugger <<!>> \n");
	else
		printf("[+] DONE \n");

//----------------------------------------------
//	tech 2 :

	printf("\n[#] Running IsDebuggerPresent2 ... ");
	if (IsDebuggerPresent2())
		printf("<<!>> IsDebuggerPresent2 Detected A Debugger <<!>> \n");
	else
		printf("[+] DONE \n");

//----------------------------------------------
//	tech 3 :

	printf("\n[#] Running IsDebuggerPresent3 ... ");
	if (IsDebuggerPresent3())
		printf("<<!>> IsDebuggerPresent3 Detected A Debugger <<!>> \n");
	else
		printf("[+] DONE \n");

//----------------------------------------------
//	tech 4 :

	printf("\n[#] Running NtQIPDebuggerCheck ... ");
	if (NtQIPDebuggerCheck())
		printf("<<!>> NtQIPDebuggerCheck Detected A Debugger <<!>> \n");
	else
		printf("[+] DONE \n");

//----------------------------------------------
//	tech 5 :

	printf("\n[#] Running HardwareBpCheck ... ");
	if (HardwareBpCheck())
		printf("<<!>> HardwareBpCheck Detected A Debugger <<!>> \n");
	else
		printf("[+] DONE \n");

//----------------------------------------------
//	tech 6 :

	printf("\n[#] Running BlackListedProcessesCheck ... ");
	if (BlackListedProcessesCheck())
		printf("<<!>> BlackListedProcessesCheck Detected A Debugger <<!>> \n");
	else
		printf("[+] DONE \n");

//----------------------------------------------
//	tech 7 :

	printf("\n[#] Running TimeTickCheck1 ... ");
	if (TimeTickCheck1())
		printf("<<!>> TimeTickCheck1 Detected A Debugger <<!>> \n");
	else
		printf("[+] DONE \n");

//----------------------------------------------
//	tech 8 :

	printf("\n[#] Running TimeTickCheck2 ... ");
	if (TimeTickCheck2())
		printf("<<!>> TimeTickCheck2 Detected A Debugger <<!>> \n");
	else
		printf("[+] DONE \n");

//----------------------------------------------
//	tech 9 :

	printf("\n[#] Running DebugBreakCheck ... ");
	if (DebugBreakCheck())
		printf("<<!>> DebugBreakCheck Detected A Debugger <<!>> \n");
	else
		printf("[+] DONE \n");

//----------------------------------------------
//	tech 10 :

	printf("\n[#] Running OutputDebugStringCheck ... ");
	if (OutputDebugStringCheck())
		printf("<<!>> OutputDebugStringCheck Detected A Debugger <<!>> \n");
	else
		printf("[+] DONE \n");


	printf("\n[#] Press <Enter> To Quit ... ");
	getchar();

	return 0;
}
Full Archive Manifest (6 files inside .zip)
- AntiDebug/AntiDebug.sln
- AntiDebug/AntiDebug/AntiDebug.c
- AntiDebug/AntiDebug/AntiDebug.vcxproj
- AntiDebug/AntiDebug/AntiDebug.vcxproj.filters
- AntiDebug/AntiDebug/AntiDebug.vcxproj.user
- AntiDebug/AntiDebug/Structs.h