Event Tracing For Windows - ETW Tools
The previous module introduced covered theoretical concepts surrounding ETW architecture, components and their functionality. This module will introduce several tools that allow...
Jump to Section (11)
Introduction
The previous module introduced covered theoretical concepts surrounding ETW architecture, components and their functionality. This module will introduce several tools that allow a user to engage with ETW. Interacting with ETW provides the reader with a practical understanding of its functionality, which serves as a prerequisite for discussing security bypass techniques.
Logman Tool
The native command-line tool for Windows, Logman, serves as an example of an ETW controller. It enables users to initiate and terminate ETW tracing sessions. These tracing sessions capture events that are then stored in files specifically designed for tracing which are typically identified by the .etl file extension. Executing the help command (/?) in Logman will result in the following output.
Microsoft ® Logman.exe (10.0.22621.1)

Usage:
  C:\Windows\system32\logman.exe [create|query|start|stop|delete|update|import|export] [options]

Verbs:
  create                        Create a new data collector.
  query                         Query data collector properties. If no name is given all data collectors are listed.
  start                         Start an existing data collector and set the begin time to manual.
  stop                          Stop an existing data collector and set the end time to manual.
  delete                        Delete an existing data collector.
  update                        Update an existing data collector's properties.
  import                        Import a data collector set from an XML file.
  export                        Export a data collector set to an XML file.

Adverbs:
  counter                       Create a counter data collector.
  trace                         Create a trace data collector.
  alert                         Create an alert data collector.
  cfg                           Create a configuration data collector.
  providers                     Show registered providers.

Options (counter):
  -c <path [path [...]]>        Performance counters to collect.
  -cf <filename>                File listing performance counters to collect, one per line.
  -f <bin|bincirc|csv|tsv|sql>  Specifies the log format for the data collector. For SQL database format, you must
                               use the -o option in the command line with the DNS!log option. The defaults is binary.
  -sc <value>                   Maximum number of samples to collect with a performance counter data collector.
  -si <[[hh:]mm:]ss>            Sample interval for performance counter data collectors.

Options (trace):
  -f <bin|bincirc|csv|tsv|sql>  Specifies the log format for the data collector. For SQL database format, you must
                               use the -o option in the command line with the DNS!log option. The defaults is binary.
  -mode <trace_mode>            Event Trace Session logger mode. For more information visit -
                               https://go.microsoft.com/fwlink/?LinkID=136464
  -ct <perf|system|cycle>       Specifies the clock resolution to use when logging the time stamp for each event.
                               You can use query performance counter, system time, or CPU cycle.
  -ln <logger_name>             Logger name for Event Trace Sessions.
  -ft <[[hh:]mm:]ss>            Event Trace Session flush timer.
  -[-]p <provider [flags [level]]> A single Event Trace provider to enable. The terms 'Flags' and 'Keywords' are
                               synonymous in this context.
  -pf <filename>                File listing multiple Event Trace providers to enable.
  -[-]rt                        Run the Event Trace Session in real-time mode.
  -[-]ul                        Run the Event Trace Session in user mode.
  -bs <value>                   Event Trace Session buffer size in kb.
  -nb <min max>                 Number of Event Trace Session buffers.

Options (alert):
  -[-]el                        Enable/Disable event log reporting.
  -th <threshold [threshold [...]]> Specify counters and their threshold values for and alert.
  -[-]rdcs <name>               Data collector set to start when alert fires.
  -[-]tn <task>                 Task to run when alert fires.
  -[-]targ <argument>           Task arguments.
  -si <[[hh:]mm:]ss>            Sample interval for performance counter data collectors.

Options (cfg):
  -[-]ni                        Enable/Disable network interface query.
  -reg <path [path [...]]>      Registry values to collect.
  -mgt <query [query [...]]>    WMI objects to collect.
  -ftc <path [path [...]]>      Full path to the files to collect.

Options:
  -?                            Displays context sensitive help.
  -s <computer>                 Perform the command on specified remote system.
  -config <filename>            Settings file containing command options.
  [-n] <name>                   Name of the target object.
  -pid <pid>                    Process identifier.
  -xml <filename>               Name of the XML file to import or export.
  -as                           Perform the requested operation asynchronously.
  -[-]u <user [password]>       User to Run As. Entering a * for the password produces a prompt for the password.
                               The password is not displayed when you type it at the password prompt.
  -m <[start] [stop]>           Change to manual start or stop instead of a scheduled begin or end time.
  -rf <[[hh:]mm:]ss>            Run the data collector for the specified period of time.
  -b <M/d/yyyy h:mm:ss[AM|PM]>  Begin the data collector at specified time.
  -e <M/d/yyyy h:mm:ss[AM|PM]>  End the data collector at specified time.
  -o <path|dsn!log>             Path of the output log file or the DSN and log set name in a SQL database. The
                               default path is '%systemdrive%\PerfLogs\Admin'.
  -[-]r                         Repeat the data collector daily at the specified begin and end times.
  -[-]a                         Append to an existing log file.
  -[-]ow                        Overwrite an existing log file.
  -[-]v <nnnnnn|mmddhhmm>       Attach file versioning information to the end of the log name.
  -[-]rc <task>                 Run the command specified each time the log is closed.
  -[-]max <value>               Maximum log file size in MB or number of records for SQL logs.
  -[-]cnf <[[hh:]mm:]ss>        Create a new file when the specified time has elapsed or when the max size is
                               exceeded.
  -y                            Answer yes to all questions without prompting.
  -fd                           Flushes all the active buffers of an existing Event Trace Session to disk.
  -ets                          Send commands to Event Trace Sessions directly without saving or scheduling.

Note:
  Where [-] is listed, an extra - negates the option.
  For example --u turns off the -u option.

More Information:
  Microsoft TechNet - https://go.microsoft.com/fwlink/?LinkID=136332

Examples:
  logman start perf_log
  logman update perf_log -si 10 -f csv -v mmddhhmm
  logman create counter perf_log -c "\Processor(_Total)\% Processor Time"
  logman create counter perf_log -c "\Processor(_Total)\% Processor Time" -max 10 -rf 01:00
  logman create trace trace_log -nb 16 256 -bs 64 -o c:\logfile
  logman create alert new_alert -th "\Processor(_Total)\% Processor Time>50"
  logman create cfg cfg_log -reg "HKEY_LOCAL_MACHINE\SOFTWARE\Microsoft\Windows NT\CurrentVersion\\"
  logman create cfg cfg_log -mgt "root\cimv2:SELECT * FROM Win32_OperatingSystem"
  logman query providers
  logman query providers Microsoft-Windows-Diagnostics-Networking
  logman start process_trace -p Microsoft-Windows-Kernel-Process 0x10 win:Informational -ets
  logman start usermode_trace -p "Service Control Manager Trace" -ul -ets
  logman query usermode_trace -p "Service Control Manager Trace" -ul -ets
  logman stop usermode_trace -p "Service Control Manager Trace" -ul -ets
  logman start process_trace -p Microsoft-Windows-Kernel-Process -mode newfile -max 1 -o output%d.etl -ets
  logman start "NT Kernel Logger" -o log.etl -ets
  logman start "NT Kernel Logger" -p "Windows Kernel Trace" (process,thread) -ets
Creating A Trace Session Via Logman
To start an ETW tracing session using Logman, one must run the logman create trace command with Administrator privileges. The create parameter can be used to create other items as shown below:
logman create counterCreates a counter data collector.logman create cfgCreates a configuration data collector.
However, for this module, the focus will be on constructing a tracing session and therefore only the logman create trace command will be used. When creating a tracing session several parameters are required:
1. Session name The name of the session.
2.File output path The path where the .etl file should be saved. This is specified using the -o flag.
3. Provider name The name of the ETW provider which will write the events to the created session. Available ETW providers can be queried using the logman query
providerscommand. This is specified using the-pflag.
logman create trace <Session Name> -o <Path to the .etl file to create> -p <ETW provider name>Adding the -ets option to the command will send commands directly to the tracing session without saving or scheduling the session for future use. Below is an example of creating an ETW tracing session using the logman command line tool.
:: Session name - MALDEV_ETW_SESSION
:: Output file path - C:\Users\Admin\Desktop\Output.etl
:: Provider name - Microsoft-Windows-Kernel-Process
logman create trace MALDEV_ETW_SESSION -o C:\Users\Admin\Desktop\Output.etl -p Microsoft-Windows-Kernel-Process -ets
Inspecting Trace Files
Once the trace file from the MALDEV_ETW_SESSION session has been created, it can be viewed using Event Viewer. Event Viewer is a Windows tools that displays detailed information about logged events. The steps below outline how one can open a trace file using Event Viewer and investigate the events saved to it.
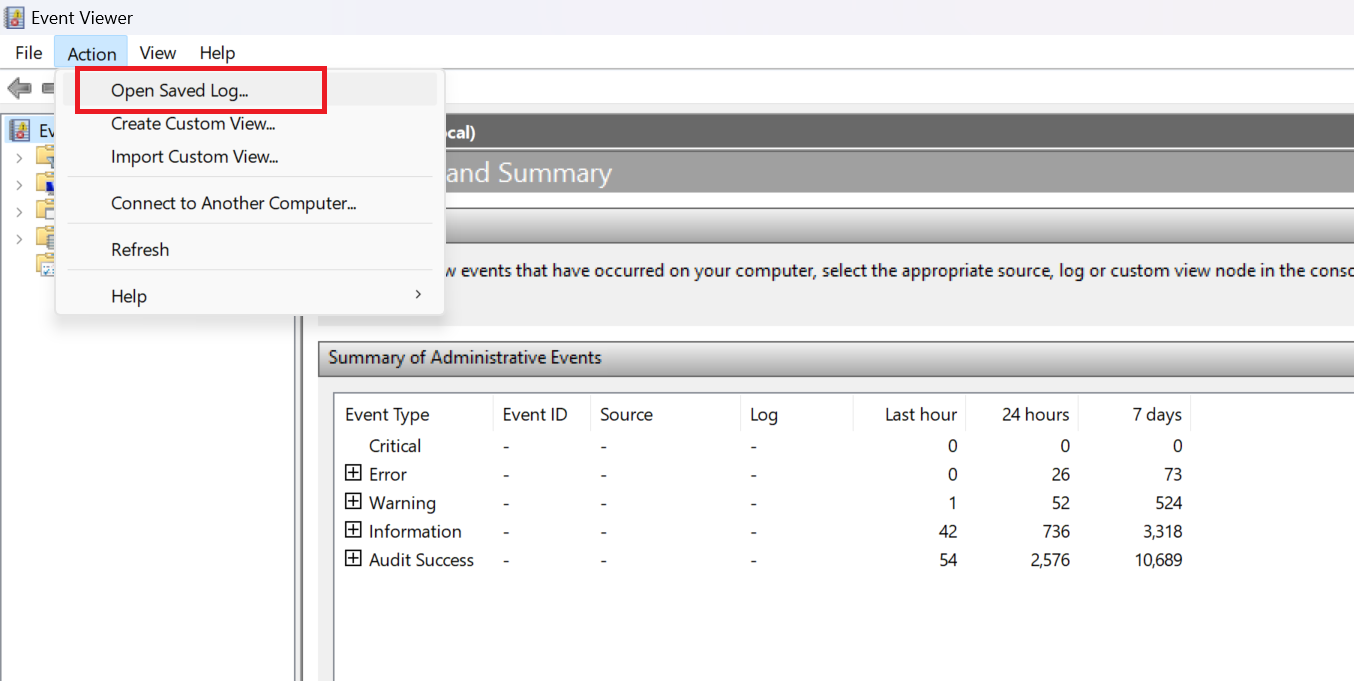
1.Open Event Viewer and go to "Action Open Saved Log".
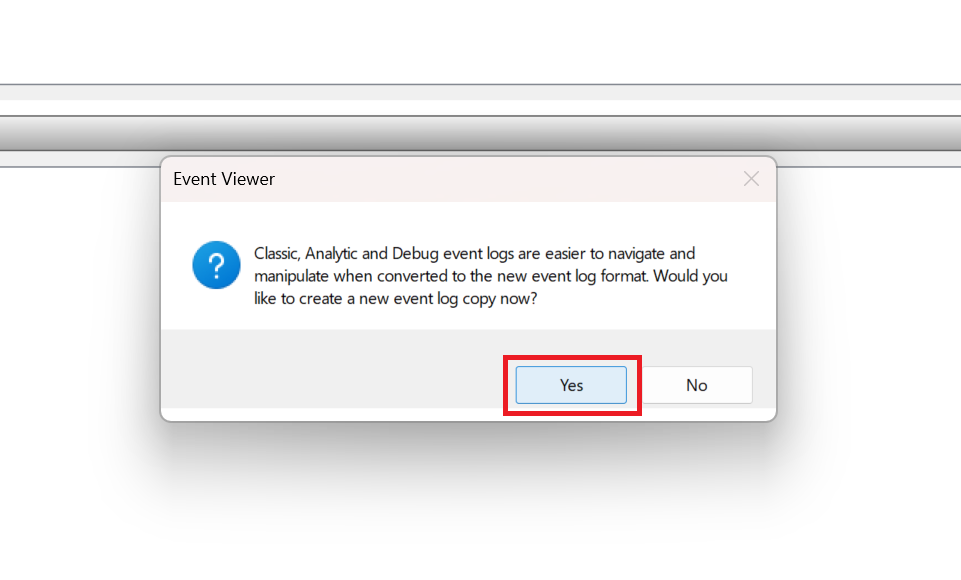
2.Click "Yes" when the message below appears.
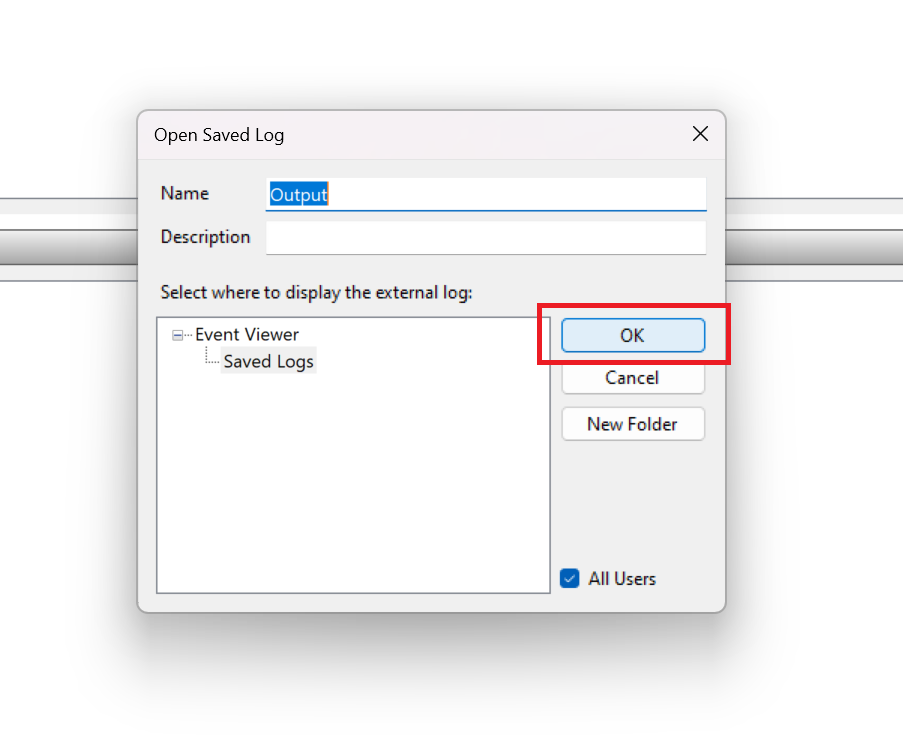
3.Press "OK" where to keep the default settings.
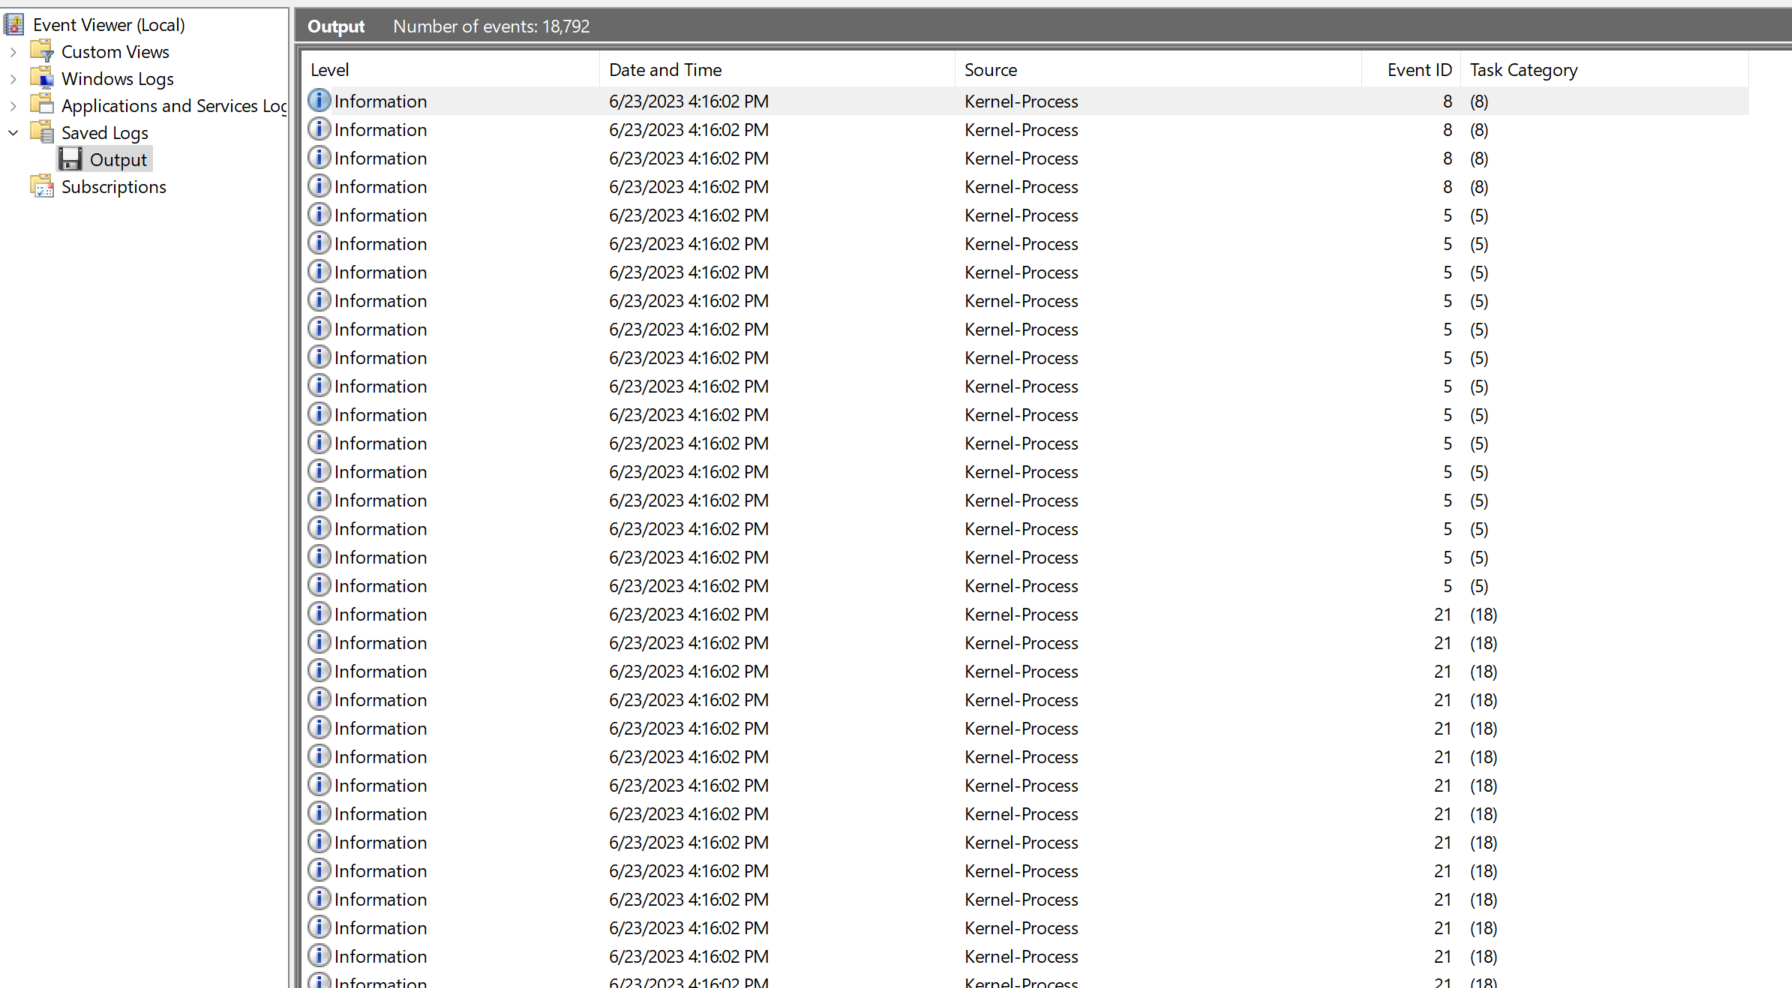
4.Next, the Output.etl file's events are shown and categorized according to event IDs.
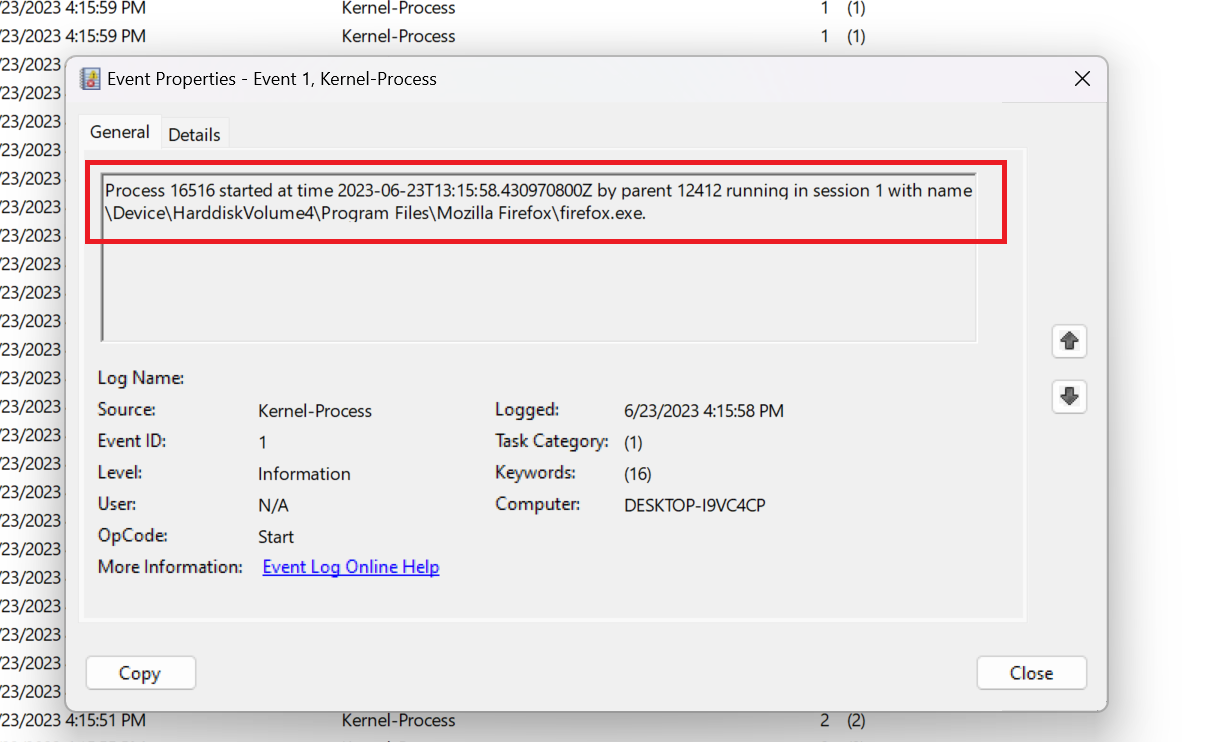
5.Double-clicking on an event will show the event's details. For example, event ID 1 is related to process creation which shows the Firefox.exe process being launched.
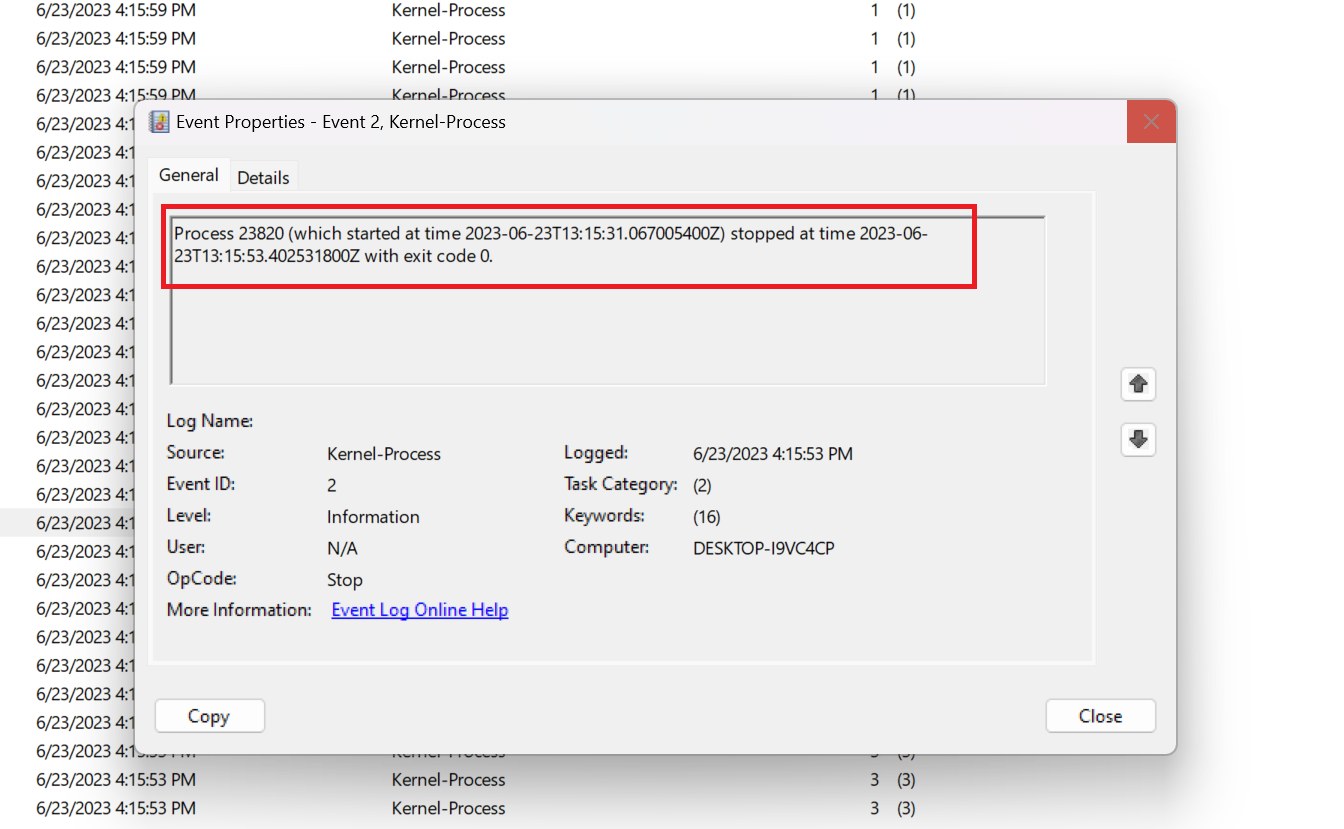
6.Different event IDs will show different types of information. For example, event ID 2 is related to process terminations.
Stopping A Trace Session Via Logman
When a tracing session is initiated, it will continue to run and log events as long as any registered provider is present until it is manually stopped. To halt an ETW tracing session using logman, the following command line can be used:
logman stop <Session Name To Stop> -etsQuerying Information Via Logman
Besides creating and stopping tracing sessions, logman can be used to query details about existing sessions. This is done using the query parameter, which can query the following information:
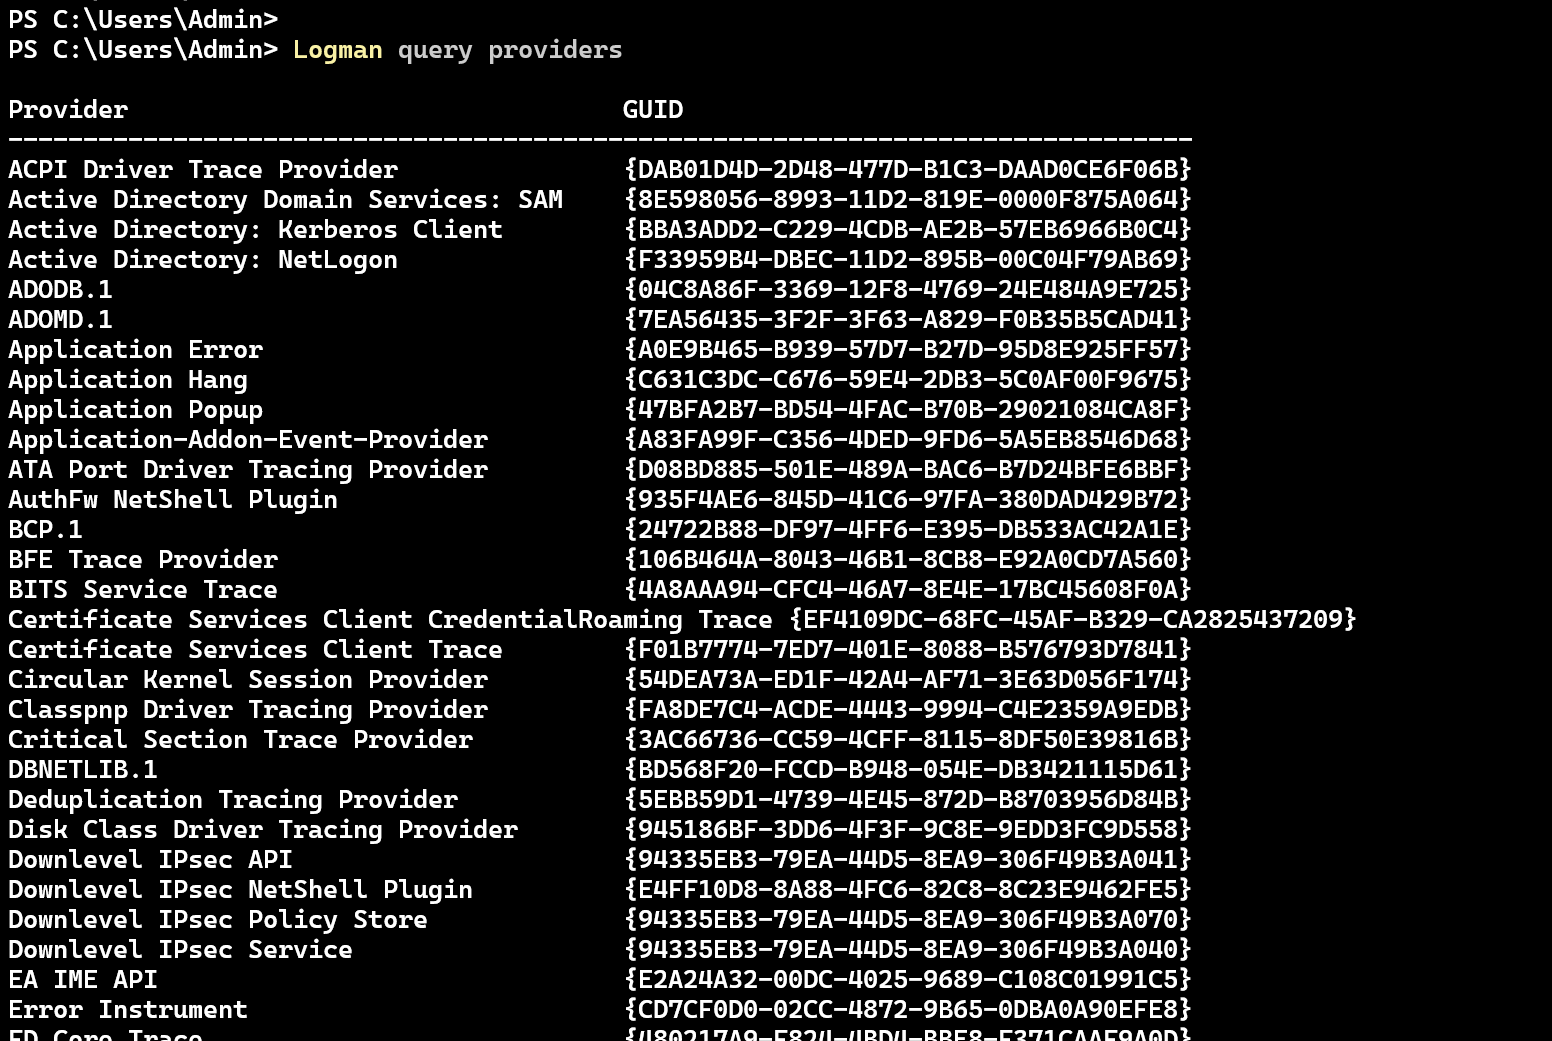
- Query ETW providers Using the
logman query providerscommand. Sample output is shown below (output is truncated due to its size).
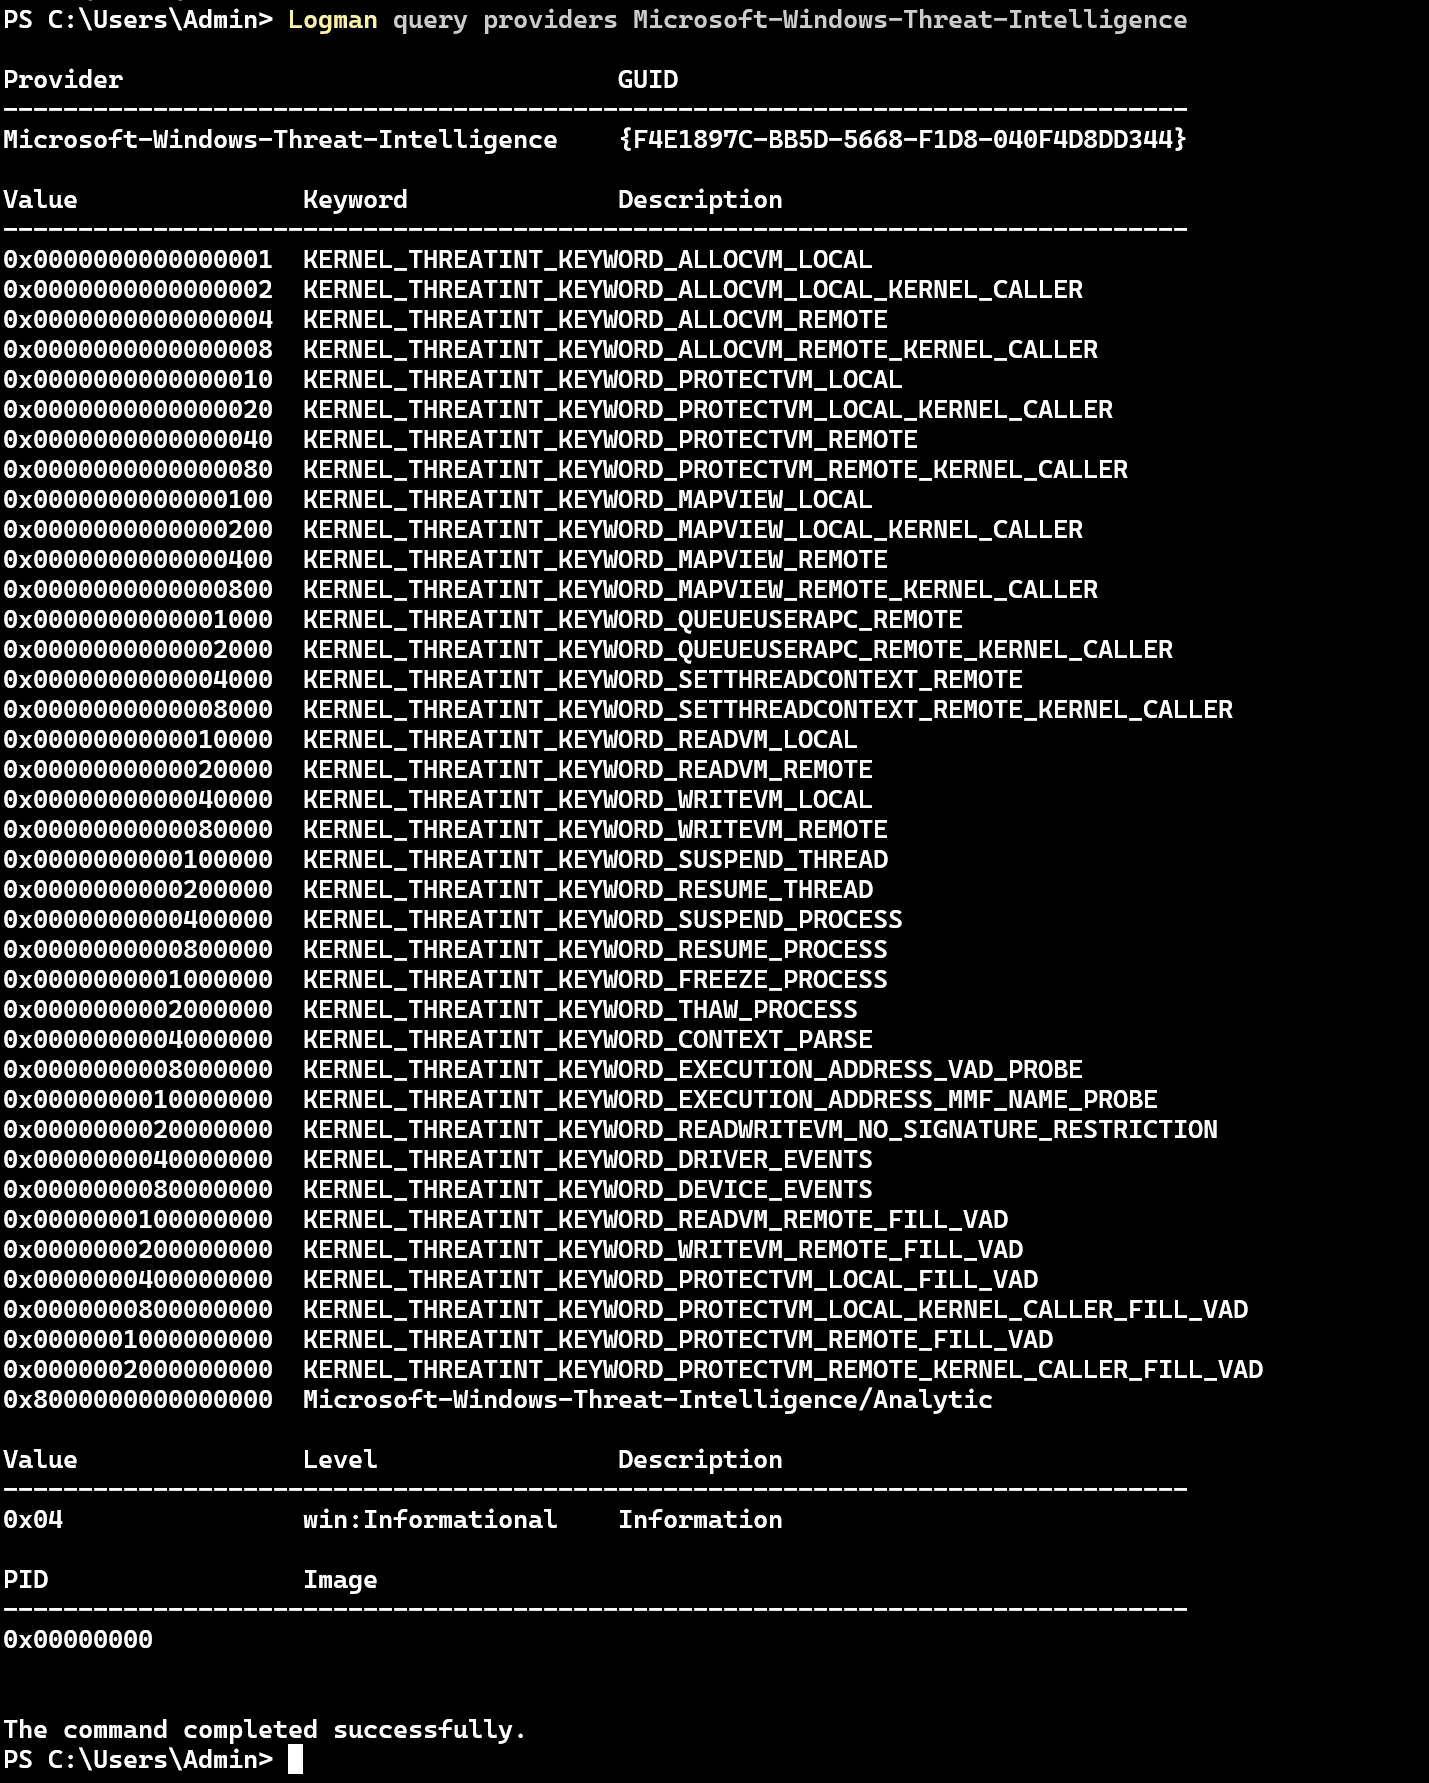
- Query information about an ETW provider Using the
logman query providers <Provider Name To Query>command. This command shows the Keywords of an ETW provider which are used to filter the events written to the tracing session when it's created. More information on keywords can be found here.
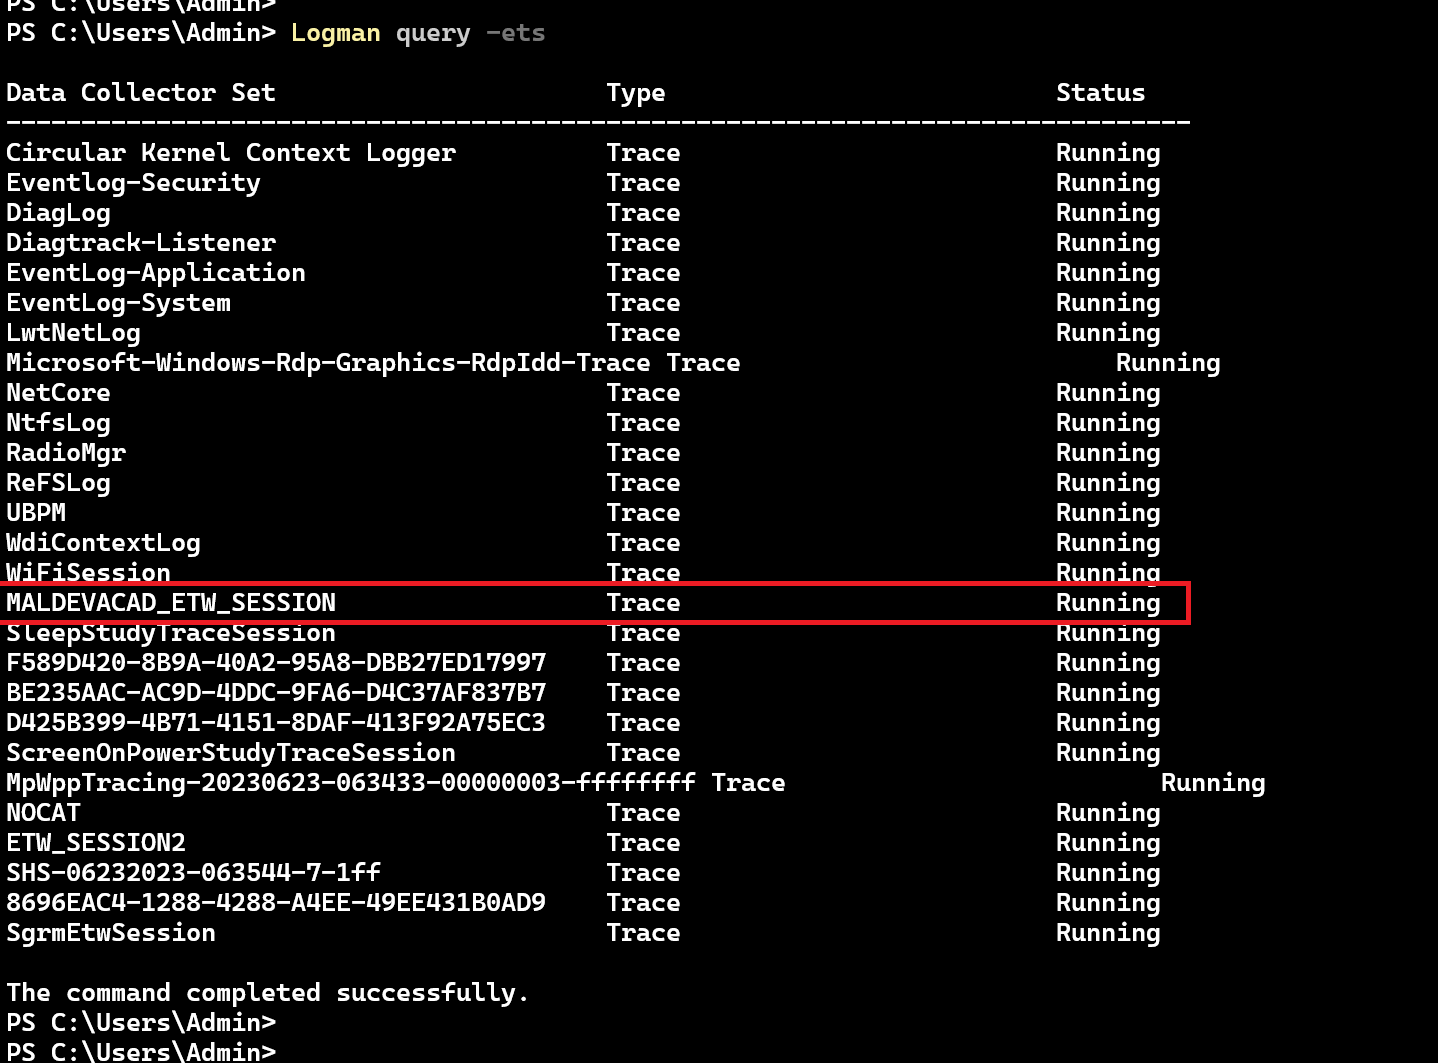
- Query running ETW tracing sessions Using the
logman query -etscommand.
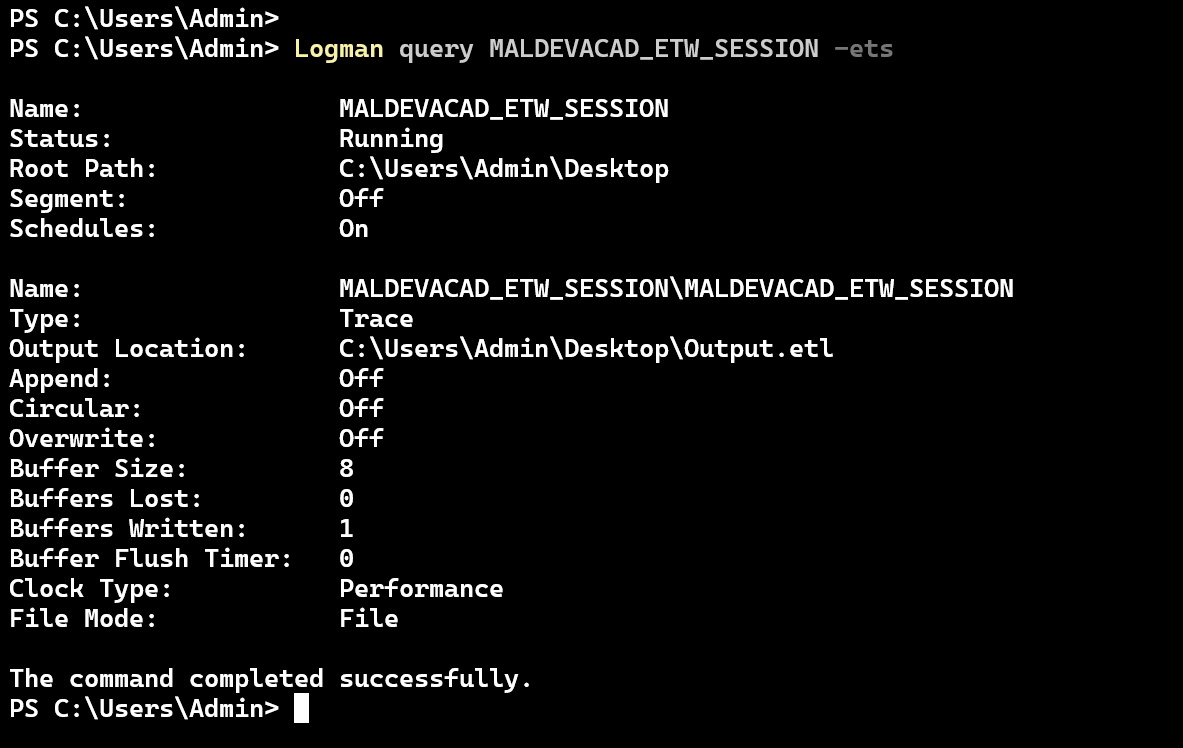
- Query information about an ETW tracing session Using the
logman query <Session Name To Query> -etscommand.
ETWExplorer
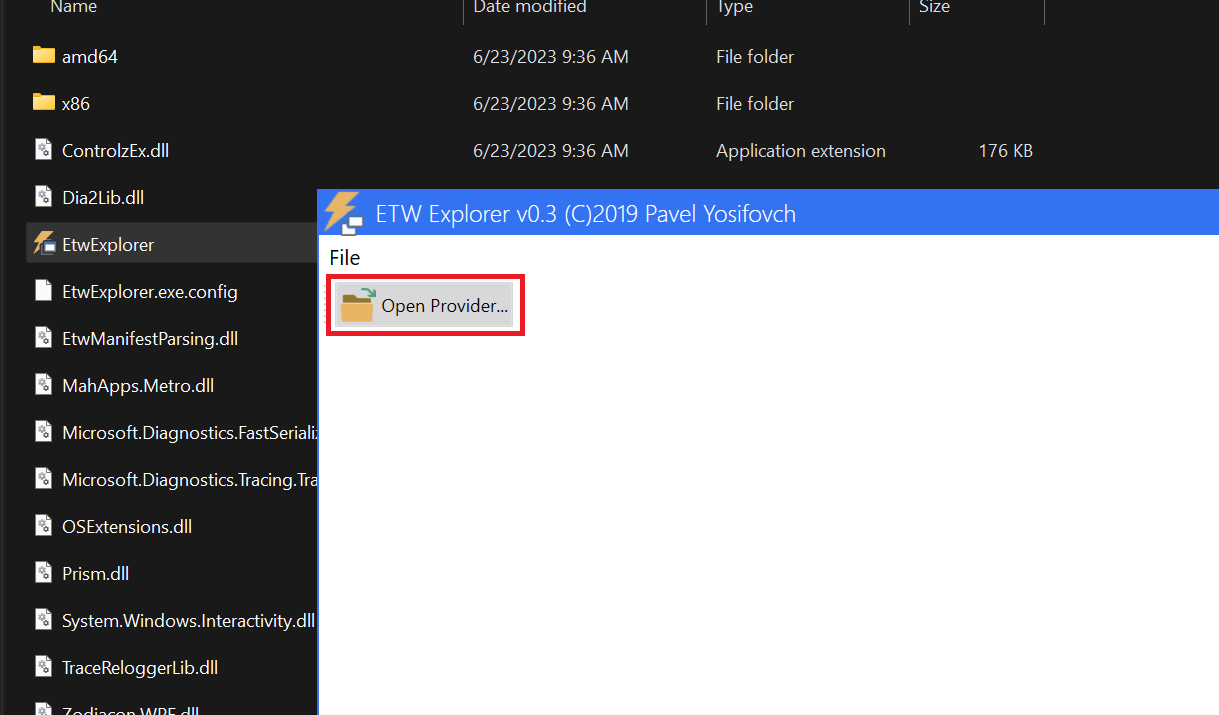
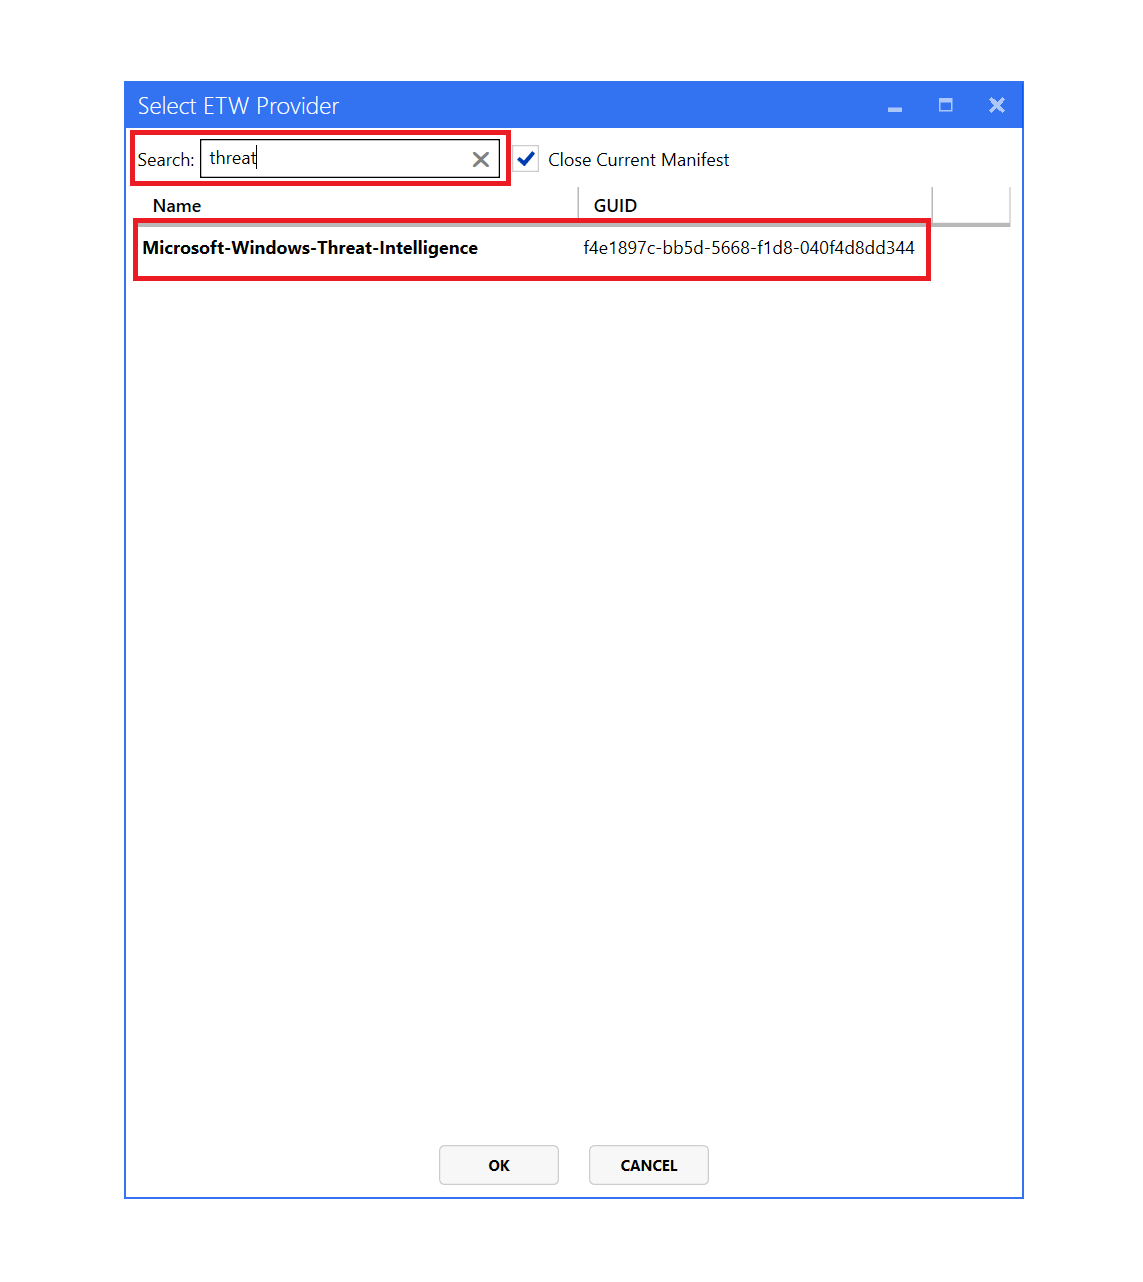
ETWExplorer is an open-source tool that facilitates in-depth analysis of ETW providers, providing insights into the information reported by each provider. To examine a particular ETW provider, such as Microsoft-Windows-Threat-Intelligence in this example, one can follow these steps after downloading the ETWExplorer tool.
1.Click "Open Provider".
2.Search for the provider's name, select it, then click "OK".
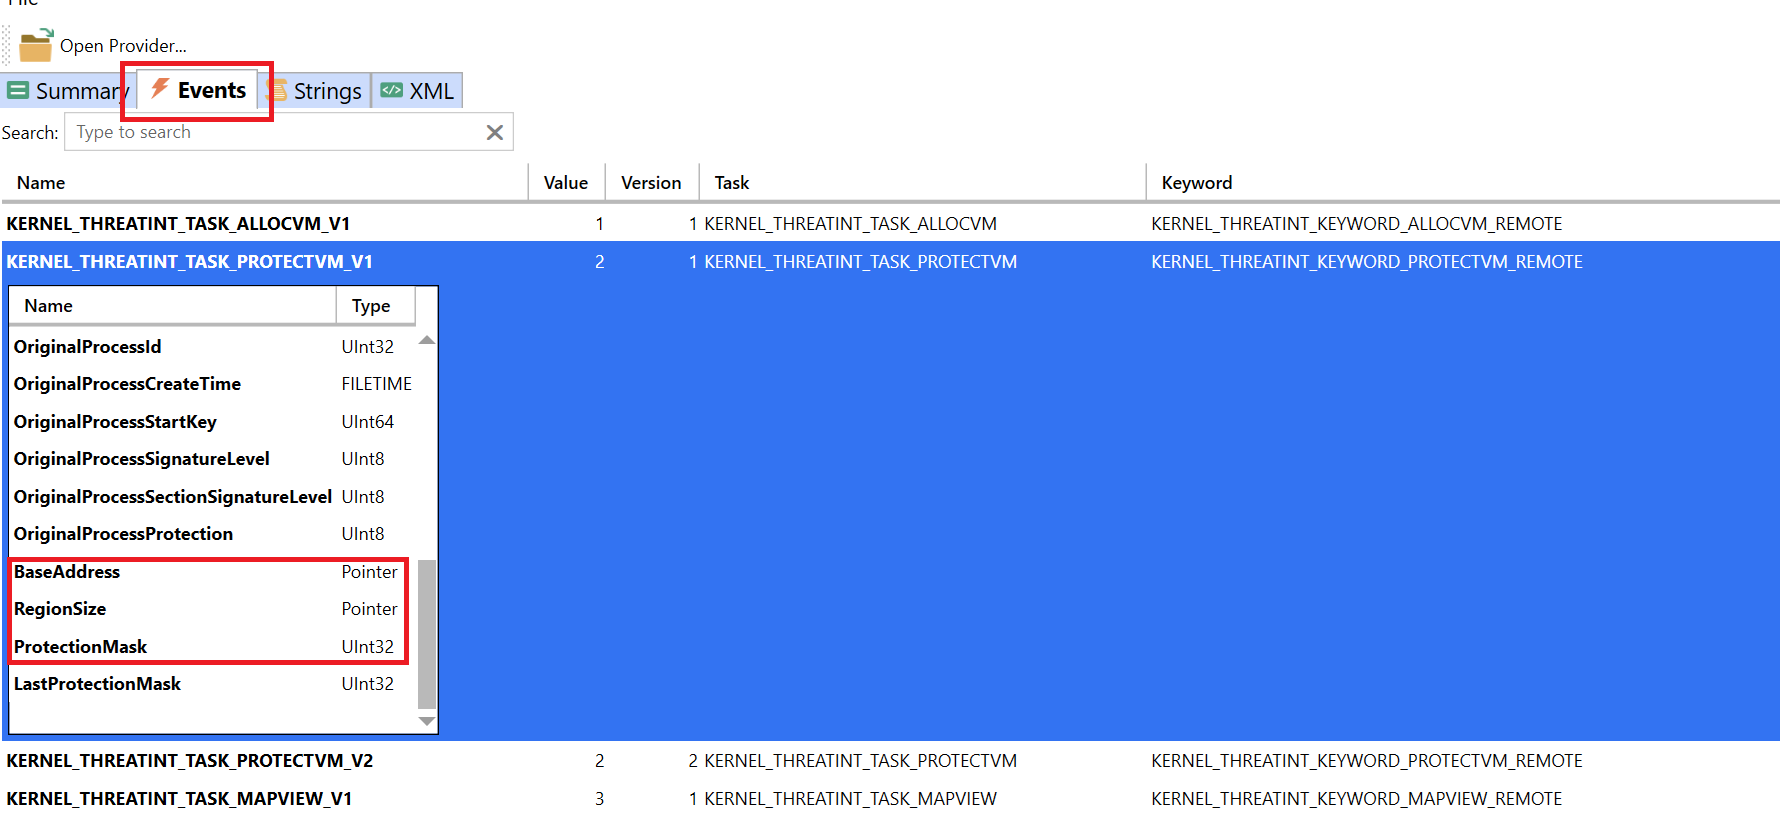
3.The Events tab provides access to the keywords associated with an ETW provider, with each keyword representing a distinct data structure that can be examined by the ETW consumer. In the image below, the occurrence of the KERNEL_THREATINT_KEYWORD_PROTECTVM_REMOTE event reveals the reported data structure, specifically the KERNEL_THREATINT_TASK_PROTECTVM_V1. This data structure includes information such as the base address and size of the remote memory that is permitted to be modified.
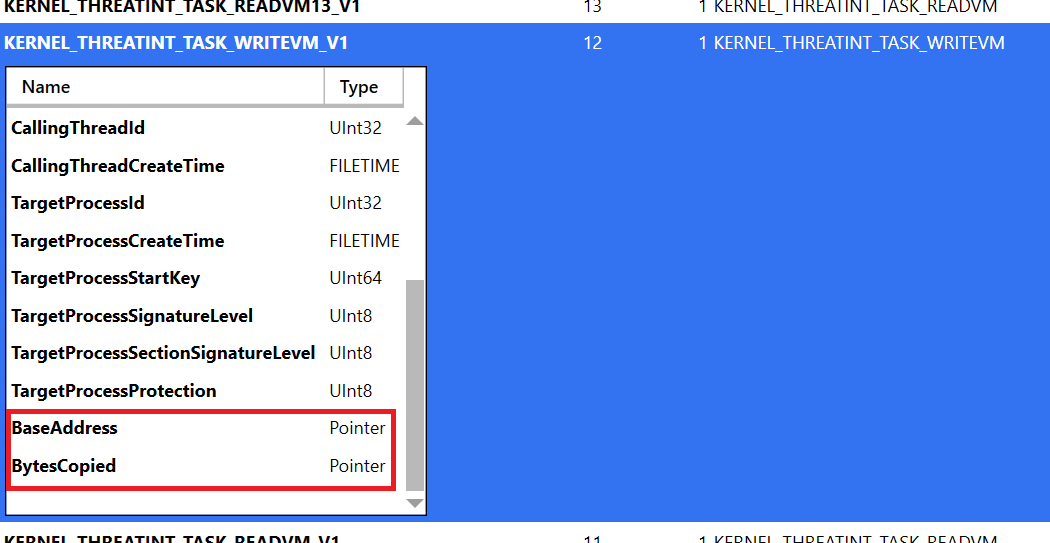
4.An additional example is the KERNEL_THREATINT_TASK_WRITEVM_V1 structure, which is reported when the KERNEL_THREATINT_KEYWORD_WRITEVM_LOCAL event occurs. Within this structure, the ETW consumer gains access to the buffers that are written to and from.
The ETWExplorer tool provides valuable insights into how security solutions programs can work as ETW consumers and leverage the reported data. For instance, it allows security products to initiate a memory scan at the indicated base addresses when specific events are triggered. This capability enhances the effectiveness of detecting and responding to relevant events.
Maldev Academy ETW Tools
In addition to the publicly available tools, this module will introduce two Maldev Academy ETW tools.
QueryEtwSessions
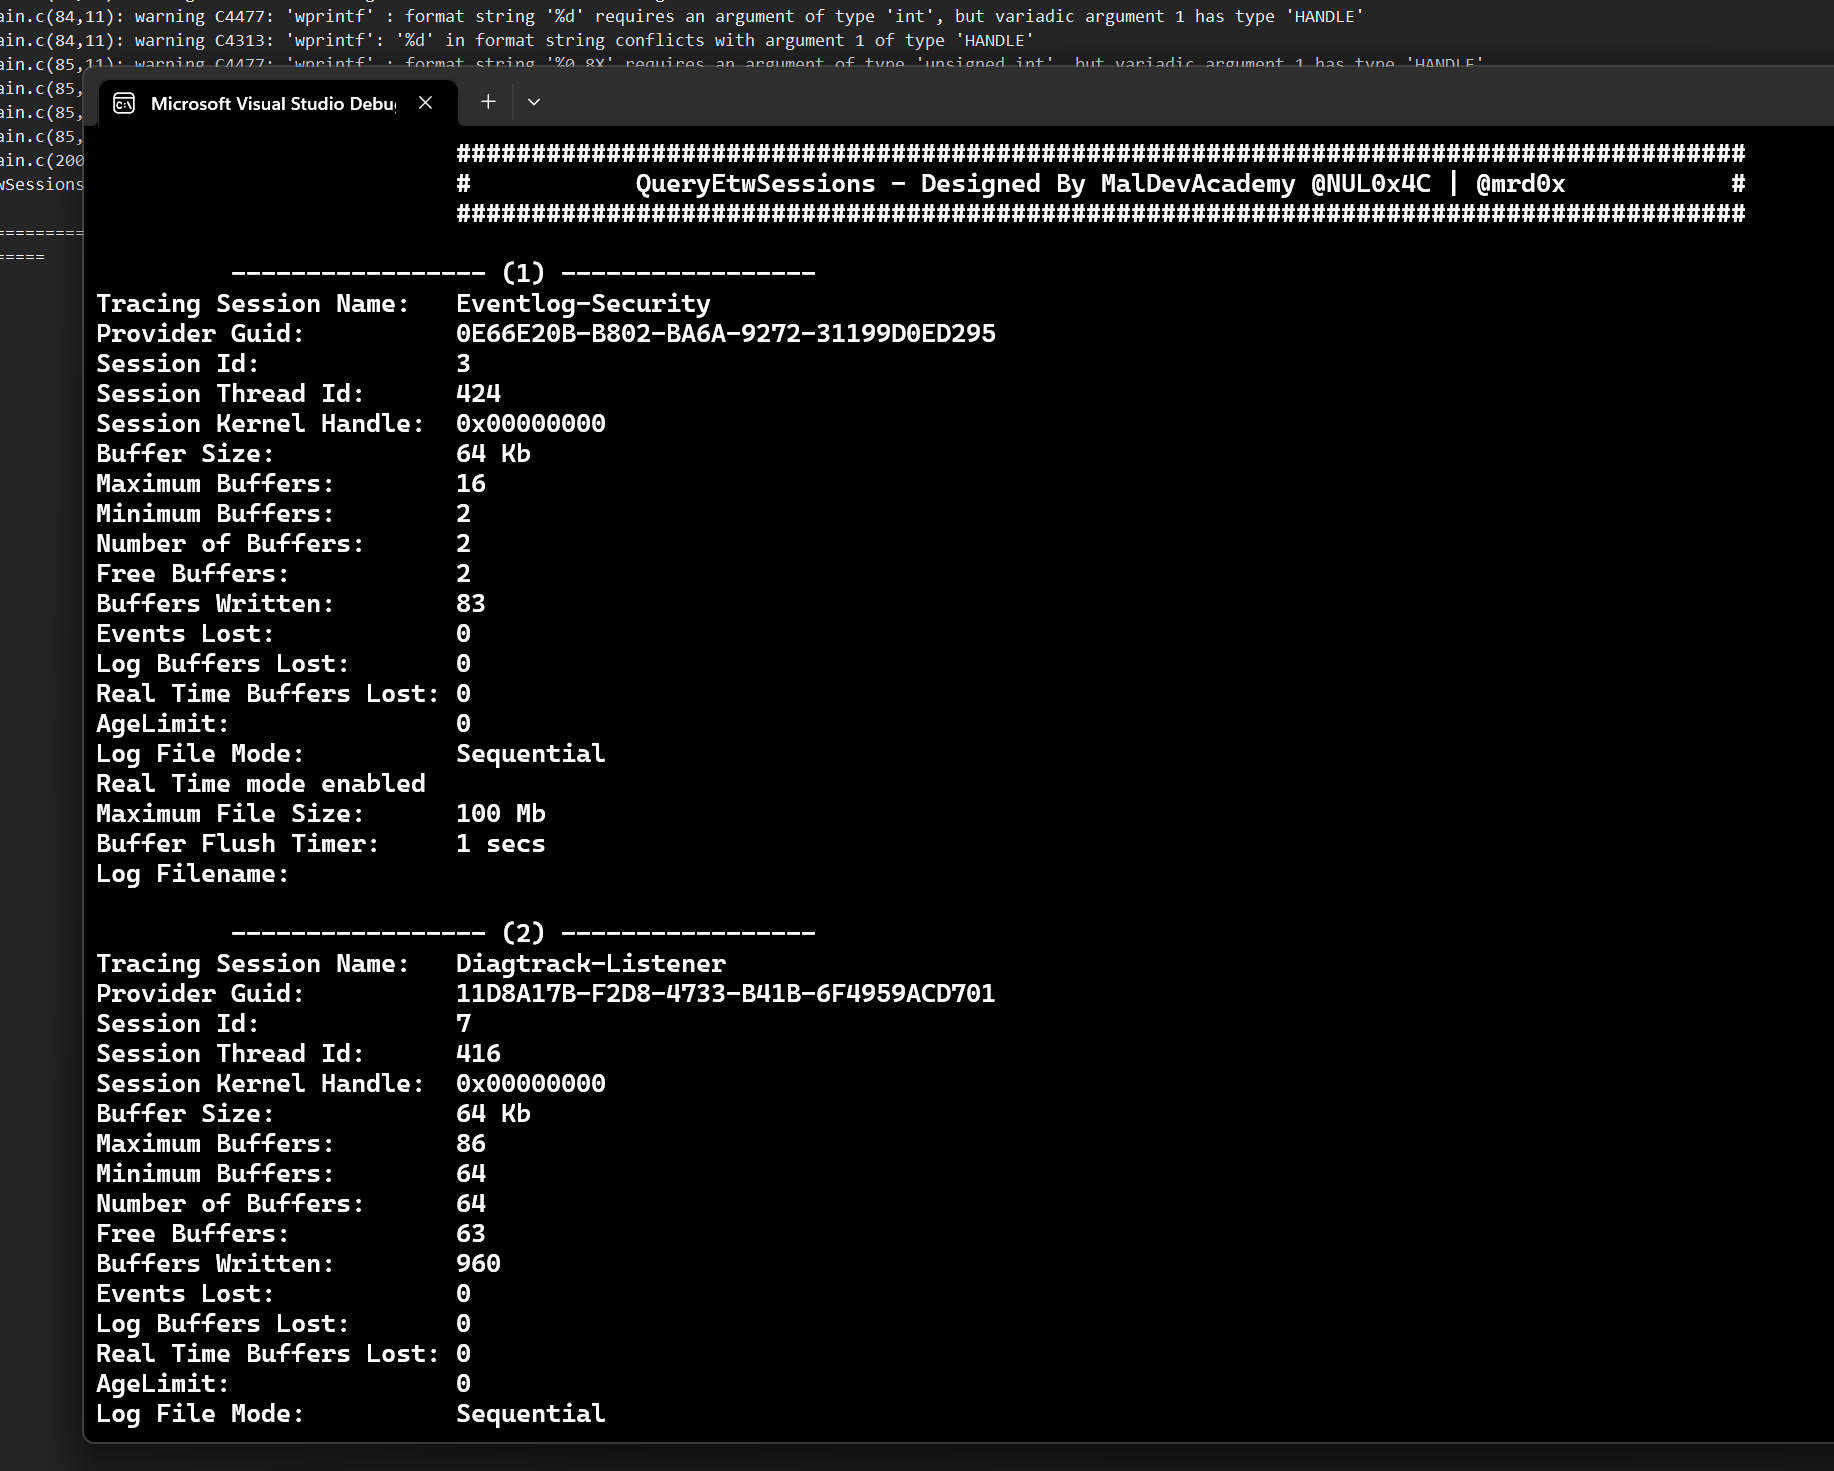
The QueryEtwSessions tool utilizes the QueryAllTracesW WinAPI to list all active ETW tracing sessions and provide essential details about each session. Understanding the tool's code is not necessary and will be addressed later if required. However, it is crucial to be familiar with the EVENT_TRACE_PROPERTIES data structure, which represents a distinct ETW tracing session and is used in most WinAPIs related to ETW tracing sessions. The image below displays the output of the QueryEtwSessions tool.
DotNetEtwConsumer
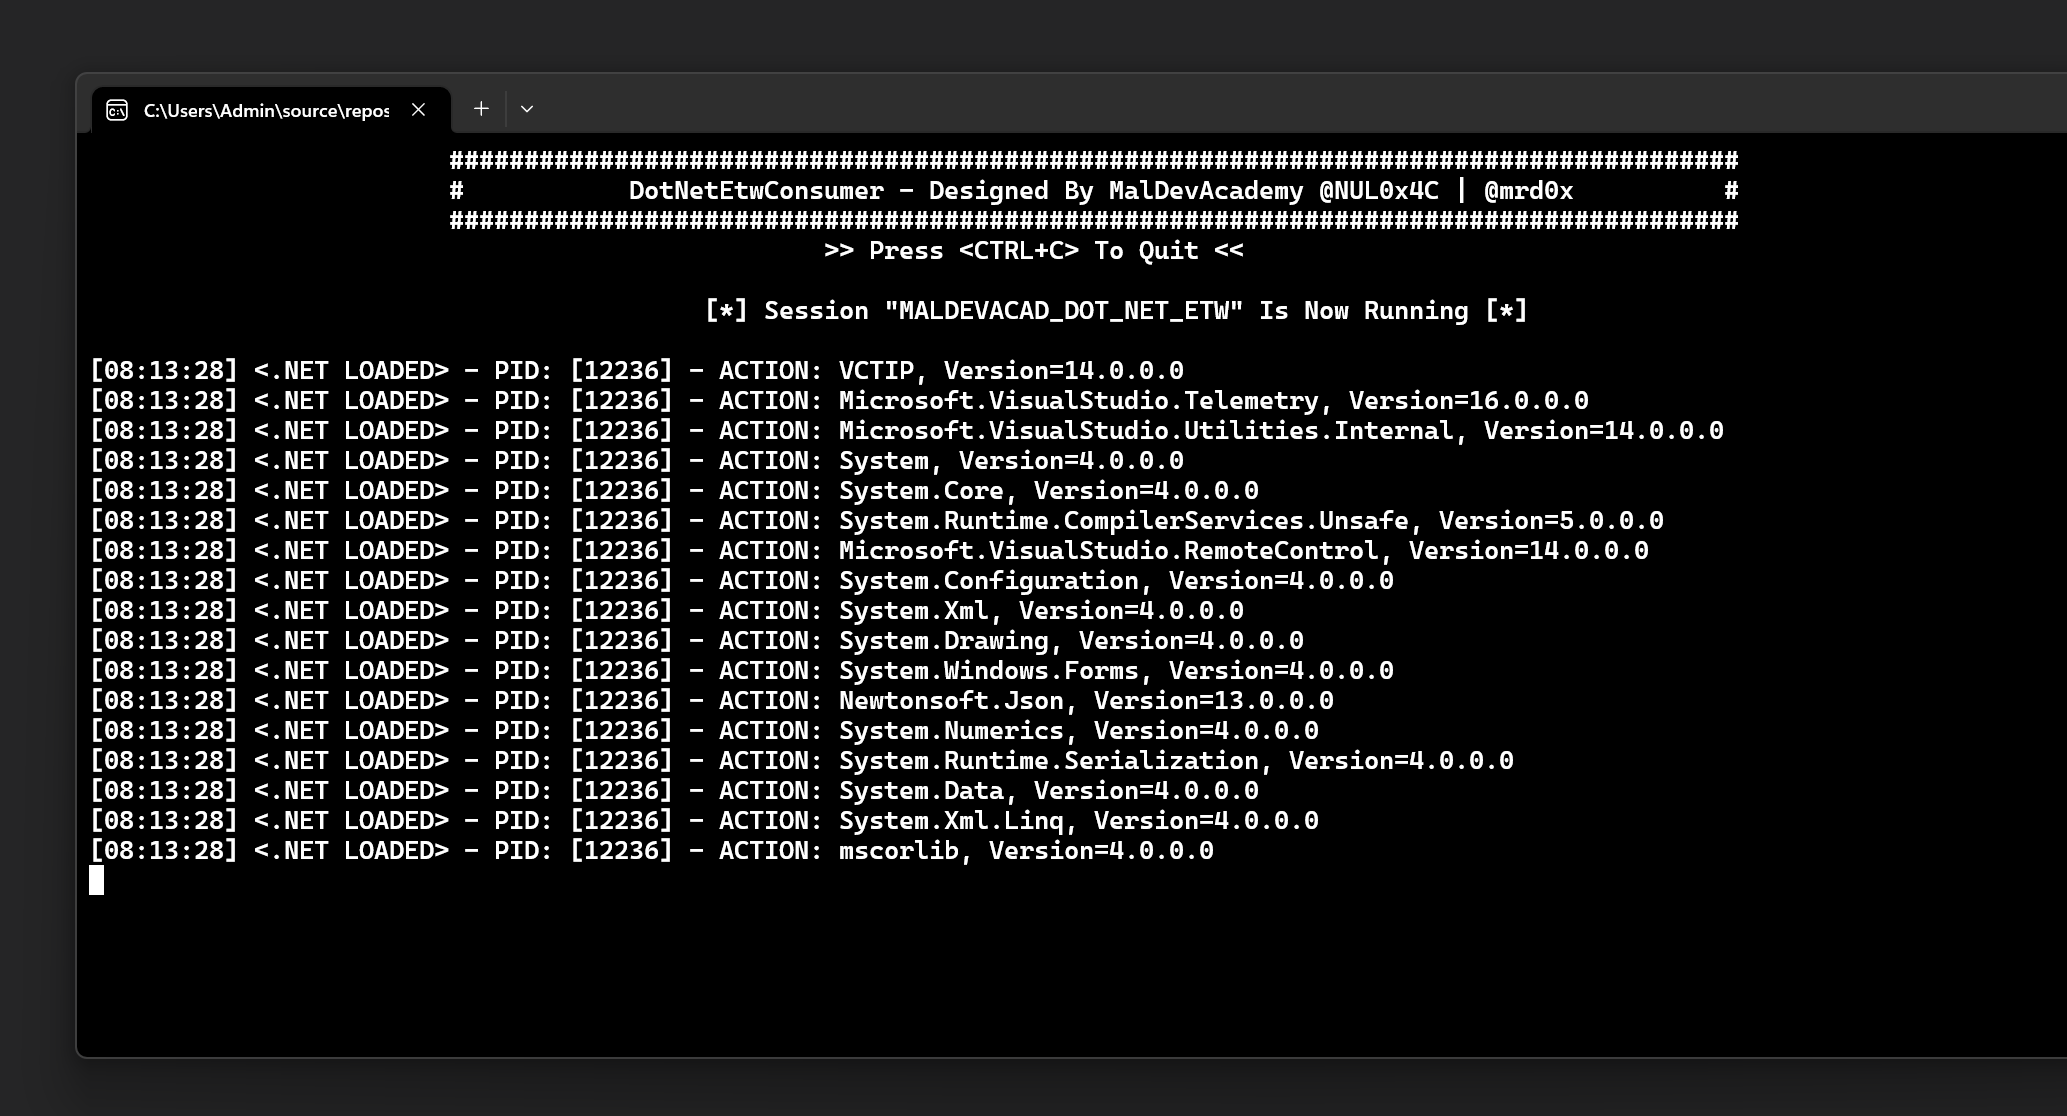
The DotNetEtwConsumer tool is an ETW consumer, that reads real-time events from the Microsoft-Windows-DotNETRuntime ETW provider, which has the {E13C0D23-CCBC- 4E12-931B-D9CC2EEE27E4} GUID. This provider reports actions related to Common Language Runtime CLR in .NET images such as loading and unloading them. DotNetEtwConsumer will print the name of the CLR .NET image loaded, the time in which it was loaded, and the PID of the process that loaded the image. The tool makes use of the following WinAPIs:
- StartTraceW Used to start an event tracing session. In the
DotNetEtwConsumertool, the session's name isMALDEVACAD_DOT_NET_ETW. - EnableTraceEx Used to configure how an ETW event provider logs events to a trace session. This WinAPI is used to filter the events to record CLR loading actions only.
- OpenTraceW Opens a handle for consuming events from an ETW real-time trace session, which is the case in the
MALDEVACAD_DOT_NET_ETWsession. ProcessTrace Delivers events from the ETW trace session to the ETW consumer. - StopTraceW Used at the end to stop a specified event tracing session. It is equivalent to the
logman stopcommand.
The image below shows the tool in action. Note that the tool will only stop recording events when the user sends an interrupt signal Ctrl C .
Similar to the previous Maldev Academy tool, understanding the code is not crucial. However, the code has been thoroughly commented to provide ease of comprehension for those interested in reading it.
Conclusion
In this module, several tools were presented that enable interaction with ETW. It is strongly advised for the reader to have a solid understanding of ETW before proceeding to the next module, as it dives into the topic of ETW evasion. Additionally, it is recommended to review the following blog posts before progressing to the next module.
Companion Project & Source Code
9 readable source/config files extracted directly from the archive
#pragma once
#include <Windows.h>

// https://github.com/winsiderss/systeminformer/blob/master/plugins/DotNetTools/clretw.h


/*
 * Copyright (c) 2022 Winsider Seminars & Solutions, Inc.  All rights reserved.
 *
 * This file is part of System Informer.
 *
 * Authors:
 *
 *     wj32    2011-2015
 *     dmex    2016-2021
 *
 */

#ifndef CLRETW_H
#define CLRETW_H

 // Keywords

#define CLR_GC_KEYWORD 0x1
#define CLR_GCHANDLE_KEYWORD 0x2
#define CLR_ASSEMBLY_LOADER_KEYWORD 0x4
#define CLR_LOADER_KEYWORD 0x8
#define CLR_JIT_KEYWORD 0x10
#define CLR_NGEN_KEYWORD 0x20
#define CLR_STARTENUMERATION_KEYWORD 0x40
#define CLR_STOPENUMERATION_KEYWORD 0x80
#define CLR_SECURITY_KEYWORD 0x400
#define CLR_APPDOMAINRESOURCEMANAGEMENT_KEYWORD 0x800
#define CLR_JITTRACING_KEYWORD 0x1000
#define CLR_INTEROP_KEYWORD 0x2000
#define CLR_CONTENTION_KEYWORD 0x4000
#define CLR_EXCEPTION_KEYWORD 0x8000
#define CLR_THREADING_KEYWORD 0x10000
#define CLR_JITTEDMETHODILTONATIVEMAP_KEYWORD 0x20000
#define CLR_OVERRIDEANDSUPPRESSNGENEVENTS_KEYWORD 0x40000
#define CLR_TYPE_KEYWORD 0x80000
#define CLR_GCHEAPDUMP_KEYWORD 0x100000
#define CLR_GCHEAPALLOCHIGH_KEYWORD 0x200000
#define CLR_GCHEAPSURVIVALANDMOVEMENT_KEYWORD 0x400000
#define CLR_GCHEAPCOLLECT_KEYWORD 0x800000
#define CLR_GCHEAPANDTYPENAMES_KEYWORD 0x1000000
#define CLR_GCHEAPALLOCLOW_KEYWORD 0x2000000
#define CLR_GCALLOBJECTALLOCATION_KEYWORD (CLR_GCHEAPALLOCHIGH_KEYWORD | CLR_GCHEAPSURVIVALANDMOVEMENT_KEYWORD)
#define CLR_PERFTRACK_KEYWORD 0x20000000
#define CLR_STACK_KEYWORD 0x40000000
#define CLR_THREADTRANSFER_KEYWORD 0x80000000
#define CLR_DEBUGGER_KEYWORD 0x100000000
#define CLR_MONITORING_KEYWORD 0x200000000
#define CLR_CODESYMBOLS_KEYWORD 0x400000000
#define CLR_EVENTSOURCE_KEYWORD 0x800000000
#define CLR_COMPILATION_KEYWORD 0x1000000000
#define CLR_COMPILATIONDIAGNOSTIC_KEYWORD 0x2000000000
#define CLR_METHODDIAGNOSTIC_KEYWORD 0x4000000000
#define CLR_TYPEDIAGNOSTIC_KEYWORD 0x8000000000
#define CLR_JITINSTRUMENTEDDATA_KEYWORD 0x10000000000
#define CLR_PROFILER_KEYWORD 0x20000000000

#define CLR_DEFAULT_KEYWORD \
     (CLR_GC_KEYWORD | CLR_TYPE_KEYWORD | CLR_GCHEAPSURVIVALANDMOVEMENT_KEYWORD | CLR_ASSEMBLY_LOADER_KEYWORD | CLR_LOADER_KEYWORD | \
     CLR_JIT_KEYWORD | CLR_NGEN_KEYWORD | CLR_OVERRIDEANDSUPPRESSNGENEVENTS_KEYWORD | CLR_STOPENUMERATION_KEYWORD | CLR_SECURITY_KEYWORD | \
     CLR_APPDOMAINRESOURCEMANAGEMENT_KEYWORD | CLR_EXCEPTION_KEYWORD | CLR_THREADING_KEYWORD | CLR_CONTENTION_KEYWORD | \
     CLR_STACK_KEYWORD | CLR_JITTEDMETHODILTONATIVEMAP_KEYWORD | CLR_THREADTRANSFER_KEYWORD | CLR_GCHEAPANDTYPENAMES_KEYWORD | \
     CLR_CODESYMBOLS_KEYWORD | CLR_COMPILATION_KEYWORD)

#define CLR_JITSYMBOLS_KEYWORD \
    (CLR_JIT_KEYWORD | CLR_STOPENUMERATION_KEYWORD | CLR_JITTEDMETHODILTONATIVEMAP_KEYWORD | CLR_OVERRIDEANDSUPPRESSNGENEVENTS_KEYWORD | CLR_LOADER_KEYWORD)

#define CLR_GCHEAPSNAPSHOT_KEYWORD \
    (CLR_GC_KEYWORD | CLR_GCHEAPCOLLECT_KEYWORD | CLR_GCHEAPDUMP_KEYWORD | CLR_GCHEAPANDTYPENAMES_KEYWORD | CLR_TYPE_KEYWORD)

// Event IDs

#define CLRStackWalkDCStart 0
#define GCSettingsRundown 10
#define MethodDCStart_V2 141
#define MethodDCEnd_V2 142
#define MethodDCStartVerbose_V2 143
#define MethodDCEndVerbose_V2 144
#define DCStartComplete_V1 145
#define DCEndComplete_V1 146
#define DCStartInit_V1 147
#define DCEndInit_V1 148
#define MethodDCStartILToNativeMap 149
#define MethodDCEndILToNativeMap 150
#define DomainModuleDCStart_V1 151
#define DomainModuleDCEnd_V1 152
#define ModuleDCStart_V1 153
#define ModuleDCStart_V2 153
#define ModuleDCEnd_V1 154
#define ModuleDCEnd_V2 154
#define AssemblyDCStart_V1 155
#define AssemblyDCEnd_V1 156
#define AppDomainDCStart_V1 157
#define AppDomainDCEnd_V1 158
#define ThreadDC 159
#define ModuleRangeDCStart 160
#define ModuleRangeDCEnd 161
#define RuntimeInformationDCStart 187

// Opcodes

#define CLR_METHODDC_DCSTARTCOMPLETE_OPCODE 14
#define CLR_METHODDC_DCENDCOMPLETE_OPCODE 15
#define CLR_MODULEDCSTART_OPCODE 35
#define CLR_MODULEDCEND_OPCODE 36

// Bit maps

// AppDomainFlags
#define AppDomainFlags_Default 0x1
#define AppDomainFlags_Executable 0x2
#define AppDomainFlags_Shared 0x4

// AssemblyFlags
#define AssemblyFlags_DomainNeutral 0x1
#define AssemblyFlags_Dynamic 0x2
#define AssemblyFlags_Native 0x4
#define AssemblyFlags_Collectible 0x8

// ModuleFlags
#define ModuleFlags_DomainNeutral 0x1
#define ModuleFlags_Native 0x2
#define ModuleFlags_Dynamic 0x4
#define ModuleFlags_Manifest 0x8
#define ModuleFlags_IbcOptimized 0x10
#define ModuleFlags_ReadyToRunModule 0x20
#define ModuleFlags_PartialReadyToRun 0x40

// StartupMode
#define StartupMode_ManagedExe 0x1
#define StartupMode_HostedCLR 0x2
#define StartupMode_IjwDll 0x4
#define StartupMode_ComActivated 0x8
#define StartupMode_Other 0x10

// StartupFlags
#define StartupFlags_CONCURRENT_GC 0x1
#define StartupFlags_LOADER_OPTIMIZATION_SINGLE_DOMAIN 0x2
#define StartupFlags_LOADER_OPTIMIZATION_MULTI_DOMAIN 0x4
#define StartupFlags_LOADER_SAFEMODE 0x10
#define StartupFlags_LOADER_SETPREFERENCE 0x100
#define StartupFlags_SERVER_GC 0x1000
#define StartupFlags_HOARD_GC_VM 0x2000
#define StartupFlags_SINGLE_VERSION_HOSTING_INTERFACE 0x4000
#define StartupFlags_LEGACY_IMPERSONATION 0x10000
#define StartupFlags_DISABLE_COMMITTHREADSTACK 0x20000
#define StartupFlags_ALWAYSFLOW_IMPERSONATION 0x40000
#define StartupFlags_TRIM_GC_COMMIT 0x80000
#define StartupFlags_ETW 0x100000
#define StartupFlags_SERVER_BUILD 0x200000
#define StartupFlags_ARM 0x400000

// RuntimeSku
#define RuntimeSku_DesktopCLR 0x1
#define RuntimeSku_CoreCLR 0x2

// Templates

#include <pshpack1.h>

typedef struct _DCStartEnd
{
    USHORT ClrInstanceID;
} DCStartEnd, * PDCStartEnd;

typedef struct _ModuleLoadUnloadRundown_V1
{
    ULONG64 ModuleID;
    ULONG64 AssemblyID;
    ULONG ModuleFlags; // ModuleFlags
    ULONG Reserved1;
    WCHAR ModuleILPath[1];
    // WCHAR ModuleNativePath[1];
    // USHORT ClrInstanceID;
} ModuleLoadUnloadRundown_V1, * PModuleLoadUnloadRundown_V1;

typedef struct _ModuleLoadUnloadRundown_V2
{
    ULONG64 ModuleID;
    ULONG64 AssemblyID;
    ULONG ModuleFlags; // ModuleFlags
    ULONG Reserved1;
    WCHAR ModuleILPath[1];
    // WCHAR ModuleNativePath[1];
    // USHORT ClrInstanceID;
    // GUID ManagedPdbSignature;
    // ULONG ManagedPdbAge;
    // WCHAR ManagedPdbBuildPath[1];
    // GUID NativePdbSignature;
    // ULONG NativePdbAge;
    // WCHAR NativePdbBuildPath[1];
} ModuleLoadUnloadRundown_V2, * PModuleLoadUnloadRundown_V2;

typedef struct _AssemblyLoadUnloadRundown_V1
{
    ULONG64 AssemblyID;
    ULONG64 AppDomainID;
    ULONG64 BindingID;
    ULONG AssemblyFlags; // AssemblyFlags
    WCHAR FullyQualifiedAssemblyName[1];
    // USHORT ClrInstanceID;
} AssemblyLoadUnloadRundown_V1, * PAssemblyLoadUnloadRundown_V1;

typedef struct _AppDomainLoadUnloadRundown_V1
{
    ULONG64 AppDomainID;
    ULONG AppDomainFlags; // AppDomainFlags
    WCHAR AppDomainName[1];
    // ULONG AppDomainIndex;
    // USHORT ClrInstanceID;
} AppDomainLoadUnloadRundown_V1, * PAppDomainLoadUnloadRundown_V1;

typedef struct _RuntimeInformationRundown
{
    USHORT ClrInstanceID;
    USHORT Sku; // RuntimeSku
    USHORT BclMajorVersion;
    USHORT BclMinorVersion;
    USHORT BclBuildNumber;
    USHORT BclQfeNumber;
    USHORT VMMajorVersion;
    USHORT VMMinorVersion;
    USHORT VMBuildNumber;
    USHORT VMQfeNumber;
    ULONG StartupFlags; // StartupFlags
    UCHAR StartupMode; // StartupMode
    WCHAR CommandLine[1];
    // GUID ComObjectGuid;
    // WCHAR RuntimeDllPath[1];
} RuntimeInformationRundown, * PRuntimeInformationRundown;

#include <poppack.h>

#endif
Full Archive Manifest (13 files inside .zip)
- DotNetEtwConsumer.zip
- DotNetEtwConsumer/DotNetEtwConsumer/DotNetEtwConsumer.sln
- DotNetEtwConsumer/DotNetEtwConsumer/DotNetEtwConsumer/DotNetEtwConsumer.vcxproj
- DotNetEtwConsumer/DotNetEtwConsumer/DotNetEtwConsumer/DotNetEtwConsumer.vcxproj.filters
- DotNetEtwConsumer/DotNetEtwConsumer/DotNetEtwConsumer/DotNetEtwConsumer.vcxproj.user
- DotNetEtwConsumer/DotNetEtwConsumer/DotNetEtwConsumer/clretw.h
- DotNetEtwConsumer/DotNetEtwConsumer/DotNetEtwConsumer/main.cpp
- QueryEtwSessions.zip
- QueryEtwSessions/QueryEtwSessions/QueryEtwSessions.sln
- QueryEtwSessions/QueryEtwSessions/QueryEtwSessions/QueryEtwSessions.vcxproj
- QueryEtwSessions/QueryEtwSessions/QueryEtwSessions/QueryEtwSessions.vcxproj.filters
- QueryEtwSessions/QueryEtwSessions/QueryEtwSessions/QueryEtwSessions.vcxproj.user
- QueryEtwSessions/QueryEtwSessions/QueryEtwSessions/main.c